
Autumn Chartbook
Monday 15 September 2025


Adoption of natural gas as a way to lower carbon emissions is a far more problematic strategy than acknowledged, and is leading the world to a very suboptimal outcome. Over the past decade, global growth of natural gas demand has plowed along at an average rate of 2% per annum—more than enough to create a vast, new path dependency on this fossil fuel. Advocates are correct when they assert that much of this adoption is replacing coal. They are even more correct when they claim a portion of this new build actually serves to boost adoption of wind and solar, given that natural gas power generation nicely dovetails with variable renewables, allowing them to achieve higher levels of penetration. So what could possibly go wrong with the strong adoption of natural gas?
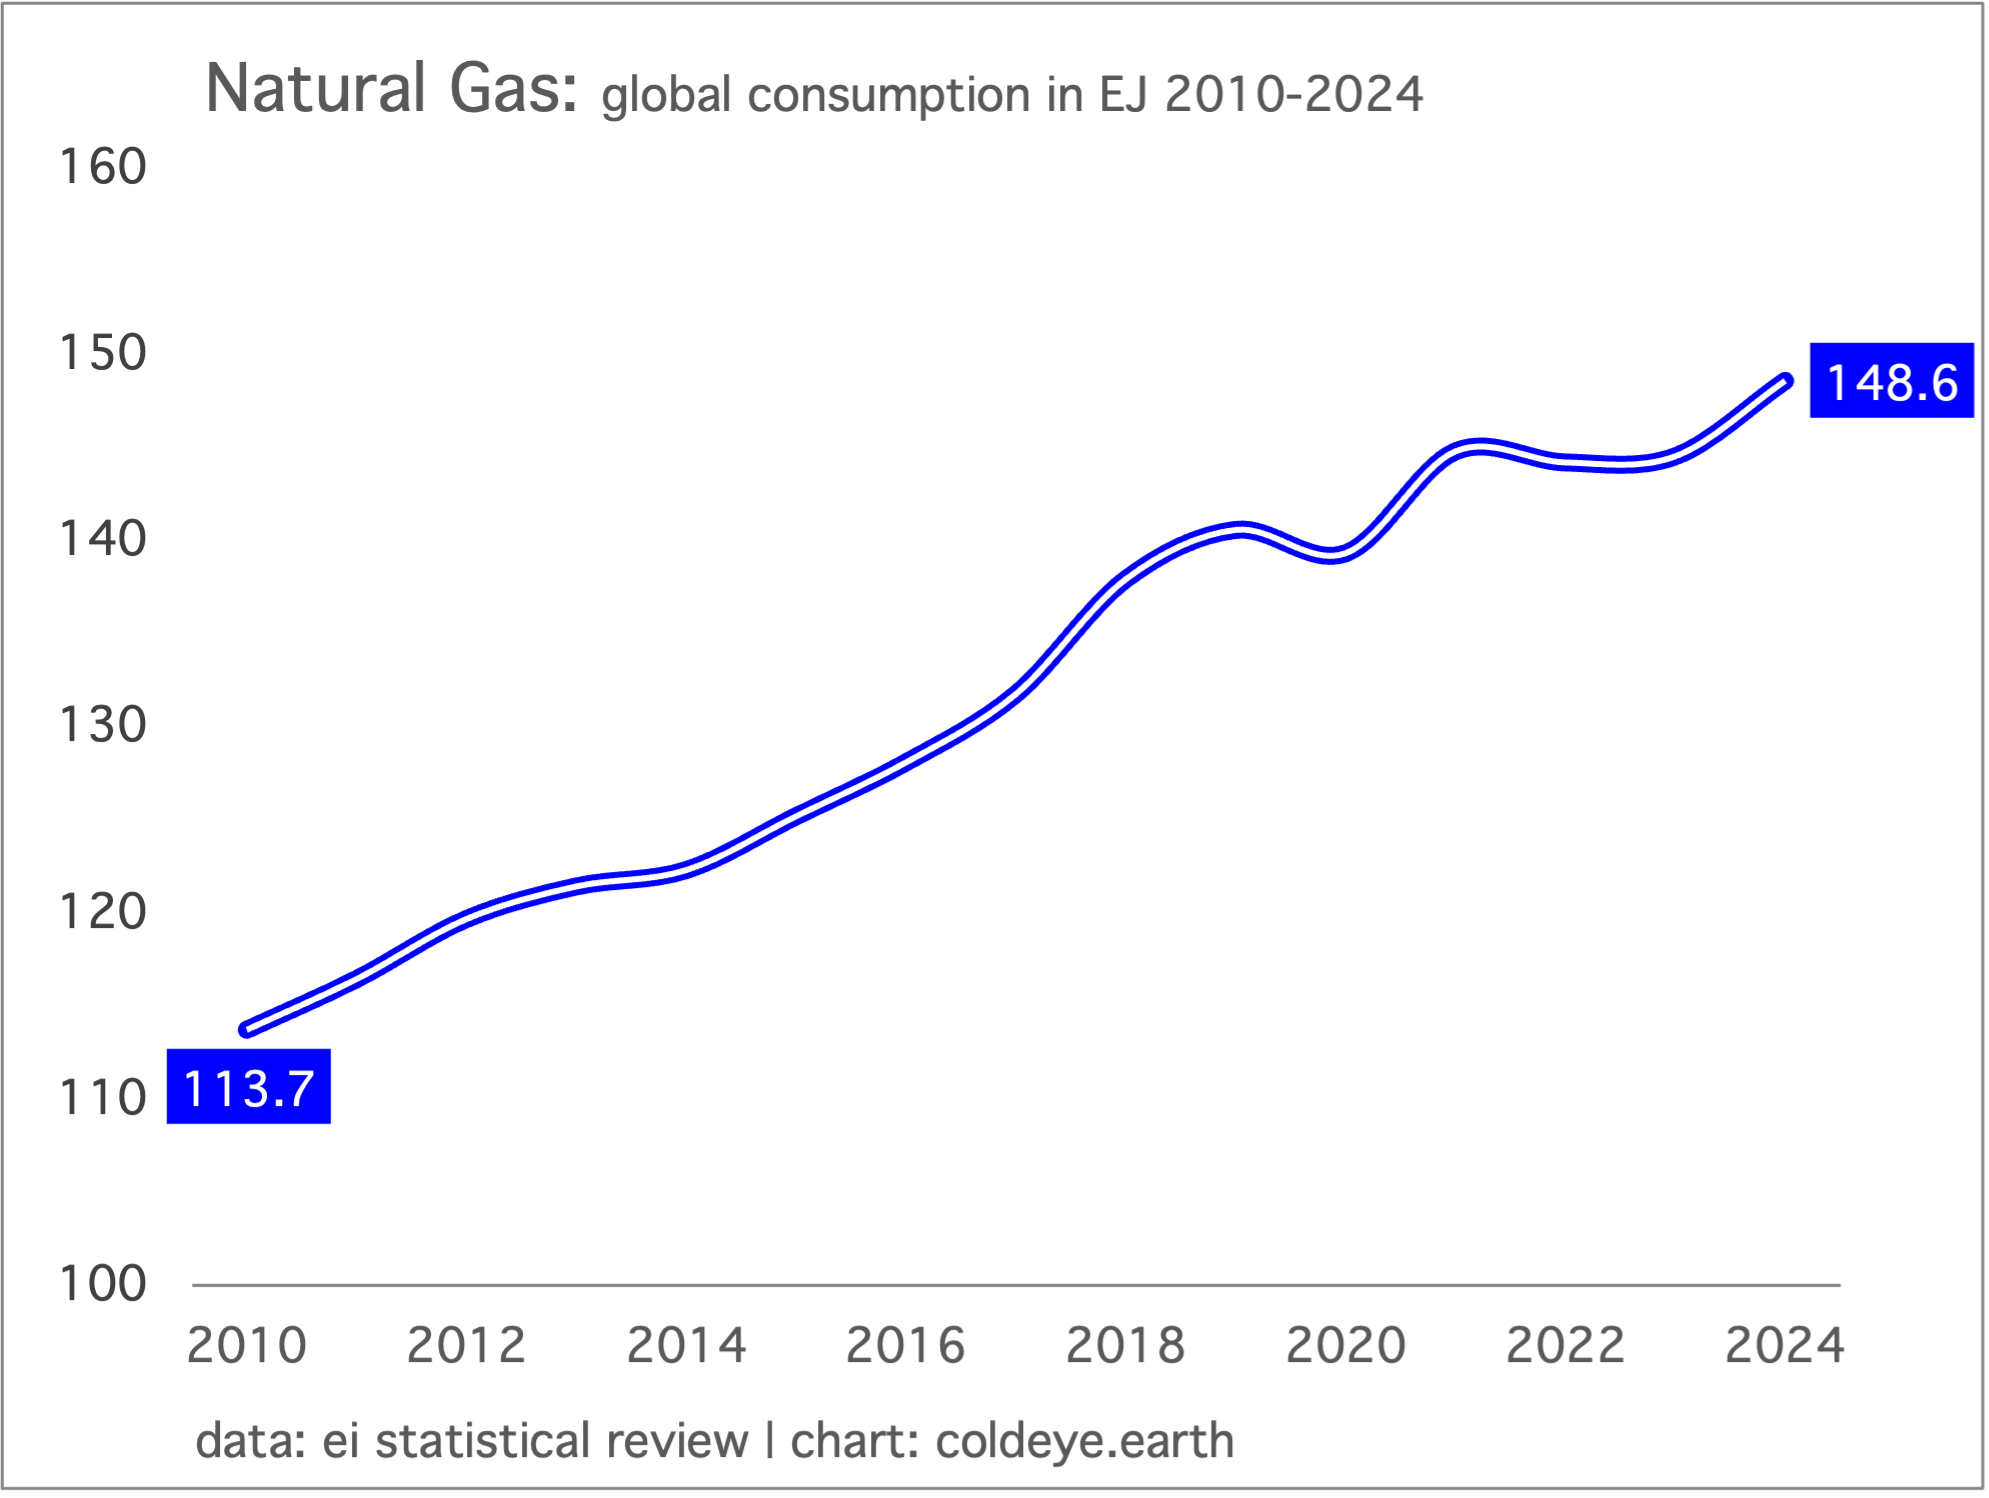
The problem is path dependency and how, as we’ve learned over time, the incumbent energy base has far more control over the pace of energy transition than the adoption of renewables. Every coal plant replaced by a new natural gas plant represents a terminal, one-time emissions gain that can’t be repeated. Afterwards, however, this new natural gas capacity then converts to the same long-term obstruction represented by the previous coal plant—suppressing the potential growth of wind, solar, and storage. Why? Because, as many still don’t fully understand, wind and solar and batteries compete strongly for new generation, but cannot overtake fossil fuel generation unless the capacity is old, and already near retirement. Finally, it needs to be highlighted that the world is not getting its coal problem under control at all. Total coal use originally peaked in 2014, flattened for six or seven years, and is now once again making new all-time highs.
Here is another chart that nicely shows the distribution of natural gas growth globally, demonstrating how very broad-based the adoption cycle has been over the past 10 to 20 years. (Clicking on the chart leads to a larger version). The only region not currently engaged in natural gas growth is the EU. But China, Asia, the “rest of the world,” and of course the U.S. are together driving the relentless growth.

Unsurprisingly, a number of observers have attempted for years to make “the big call” that natural gas growth would soon erode, but the exact opposite has happened. Even the IEA once saw a relaxation of demand on the horizon, but now they have this to say in their Natural Gas Report 2025:
Following the supply shock of 2022 and 2023, natural gas markets moved towards a gradual rebalancing and returned to structural growth in 2024. Global gas demand reached a new all-time high, with over three-quarters of growth coming from emerging market and developing economies.
Fertility rates continue to fall around the world, and that’s really not a bad thing. Just to be clear, Cold Eye Earth takes demographics seriously (as one should) but rejects all alarmist views about population bombs! and other such Malthusian thinking (as one should). Besides, we’ve been getting indications that net population growth would eventually start falling, and we have indeed been in that phase since roughly 2010, with population still growing, of course, but with each year’s addition generally smaller than the last. From 1980 through 2010, the world added between 80 and 90 million people (net) each year, but now we are tracking closer to 70 million annual net additions. Aging populations + falling fertility rates = a declining net addition each year. And according to a new UN report, The Real Fertility Crisis, fertility rates continue to fall.
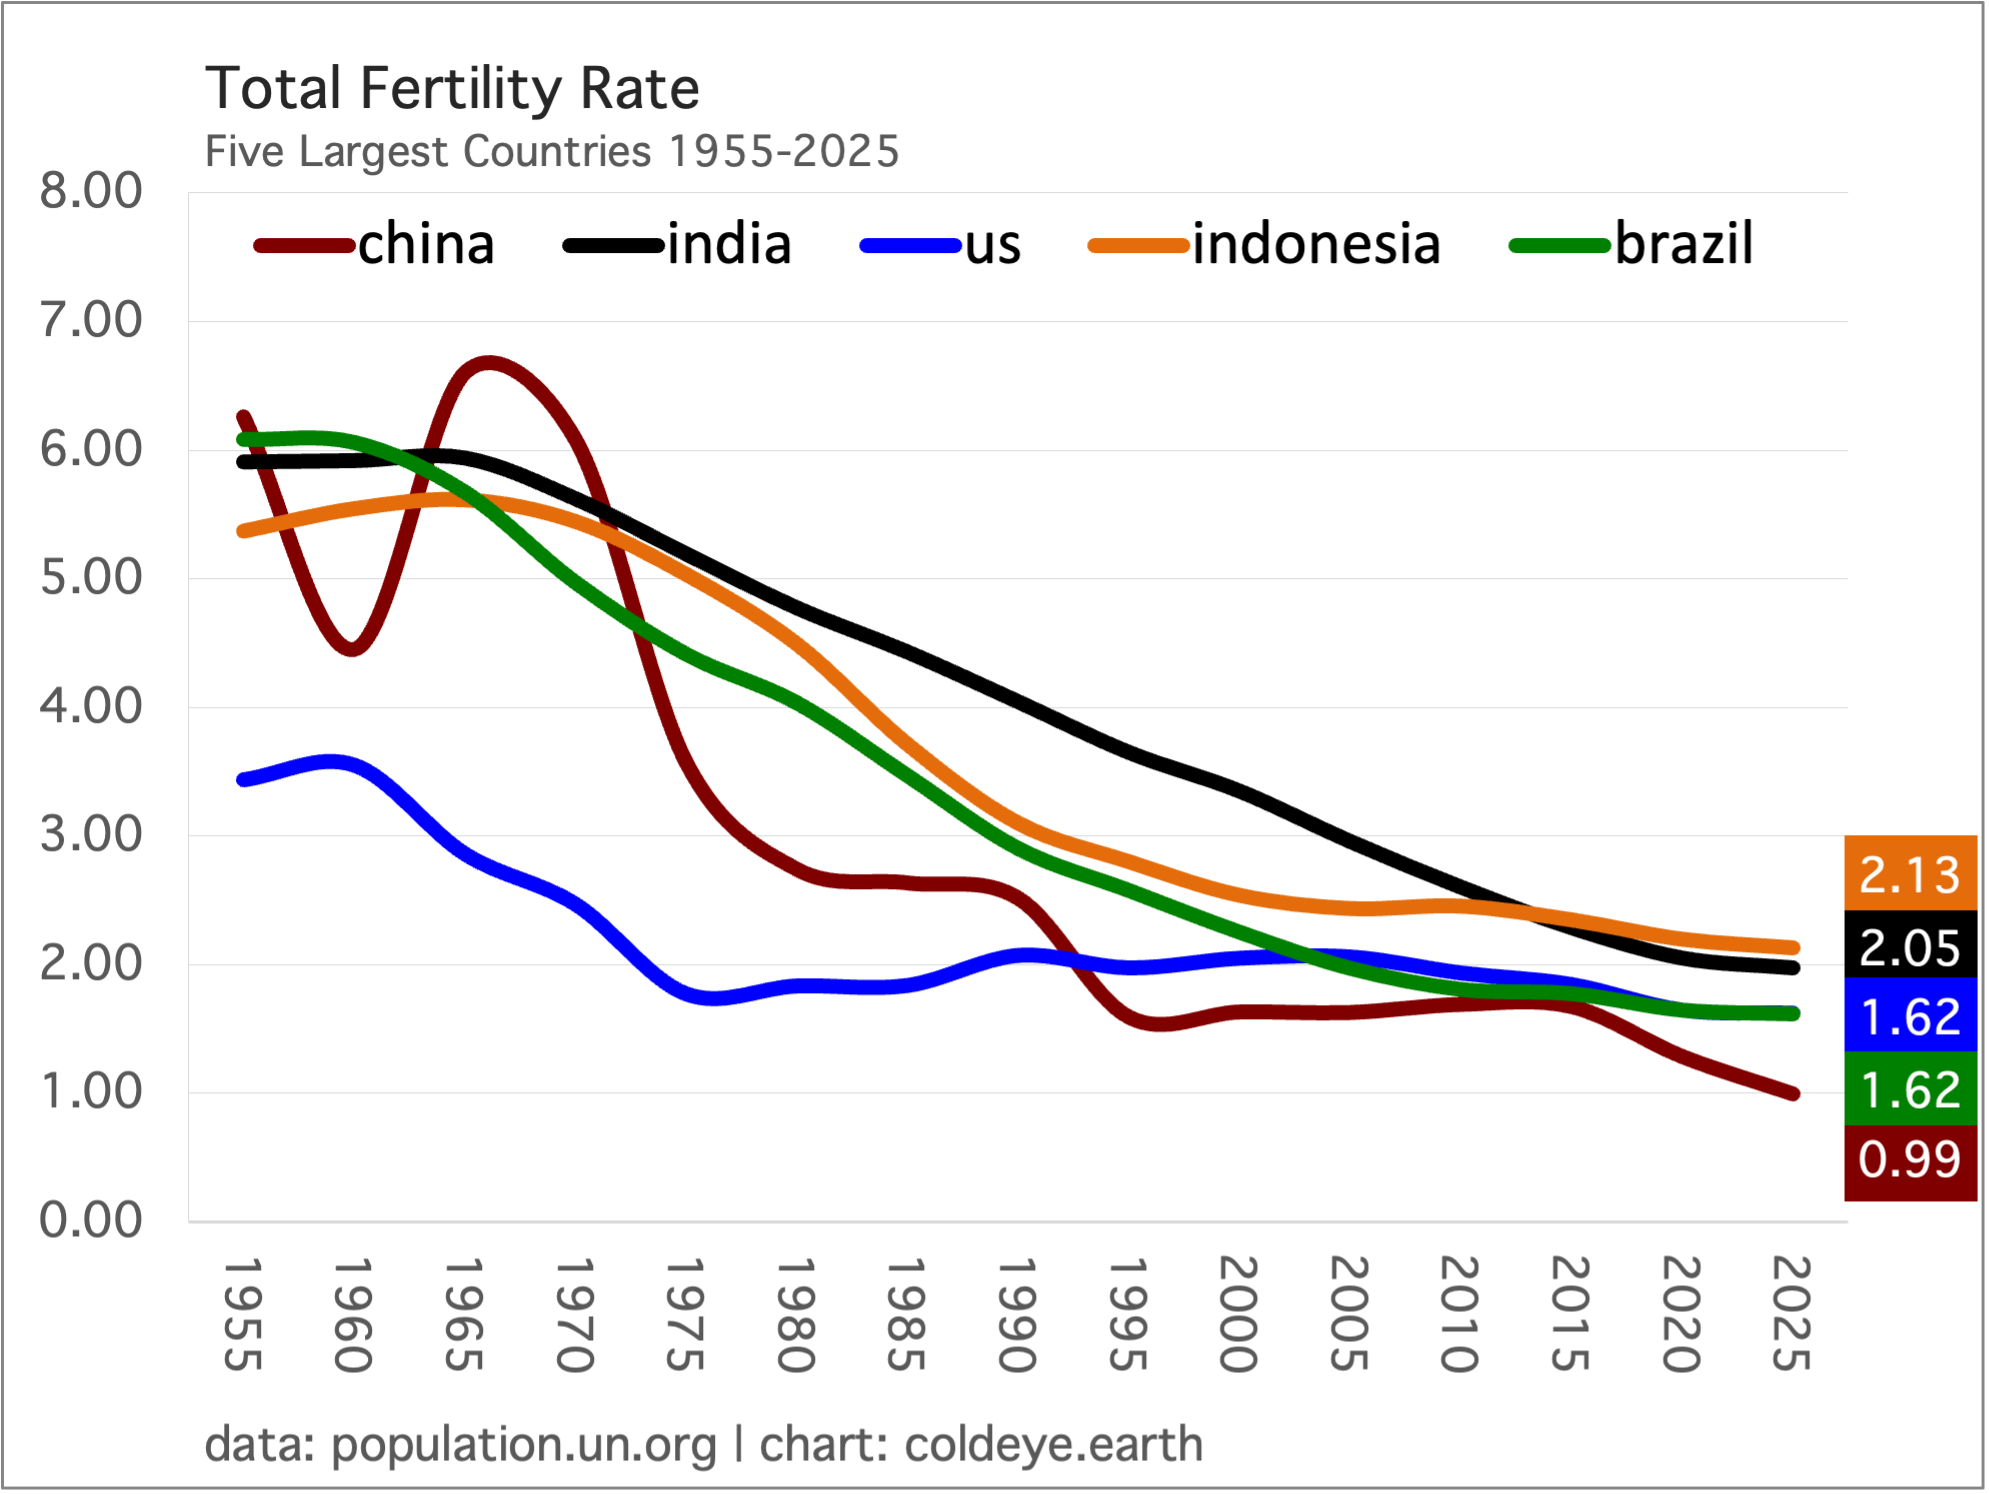
Understanding the drivers of falling fertility rates can be tricky. For example, with the exception of the U.S., mostly what you see in the chart above are the effects of economic development. When high-fertility-rate countries begin to sustainably upgrade their infrastructure, health systems, and economies, fertility rates fall, because adults have the confidence they can carry children to adulthood—thus they start to have fewer children, into which they make a greater investment.
But there’s another kind of driver of falling fertility rates, and that occurs in already developed countries as the constraints of high-cost lifestyles begin to bear down on the decision-making around the prospects of parenthood. Indeed, financial limitations are an increasing cause of lower rates, from Europe to the U.S. to developed Asia, according to the UN report.
The bottom line is that fertility rates are on course to continue their decline. The chart here uses estimates for 2024 and 2025 from the UN Population Division Bureau, but the just-released report shows these rates ticking lower. India for example, moving from 2.05 to 1.90, and the U.S., going from 1.62 to 1.60. The U.S., by the way, demonstrates all the hurdles that make it increasingly hard to have children: it’s everything from an exceedingly expensive health care system to high housing costs. And the latter plagues OECD countries that, in contrast to the U.S., do enjoy public health systems. So, in the UK, in Europe, and in Australasia, the health care costs of having a child are much lower, but the cost of housing is just as if not even more prohibitive.
Forecasts for a peak in China’s emissions need to contend with a number of trends, not least of which is the continuing advance of its per capita energy consumption. There’s an understandable hope that China is building so much clean energy capacity that both industrial emissions and consumer-driven emissions will peak soon, and then fall. The missing link in this model is the prospect that China’s population—historically tied to productive output—will see domestic consumption grow steadily as is typical of economies after they build up wealth and mature.
In the chart below, we take a look at per capita energy consumption using a new metric offered by the EI Statistical Review: TES, or Total Energy Supply. This metric attempts to count not the raw energy inputs to consumption, but rather the output of energy that’s actually used. The metric supposedly puts renewables and fossil fuels on a more equal footing, reflecting better the contribution of the former.
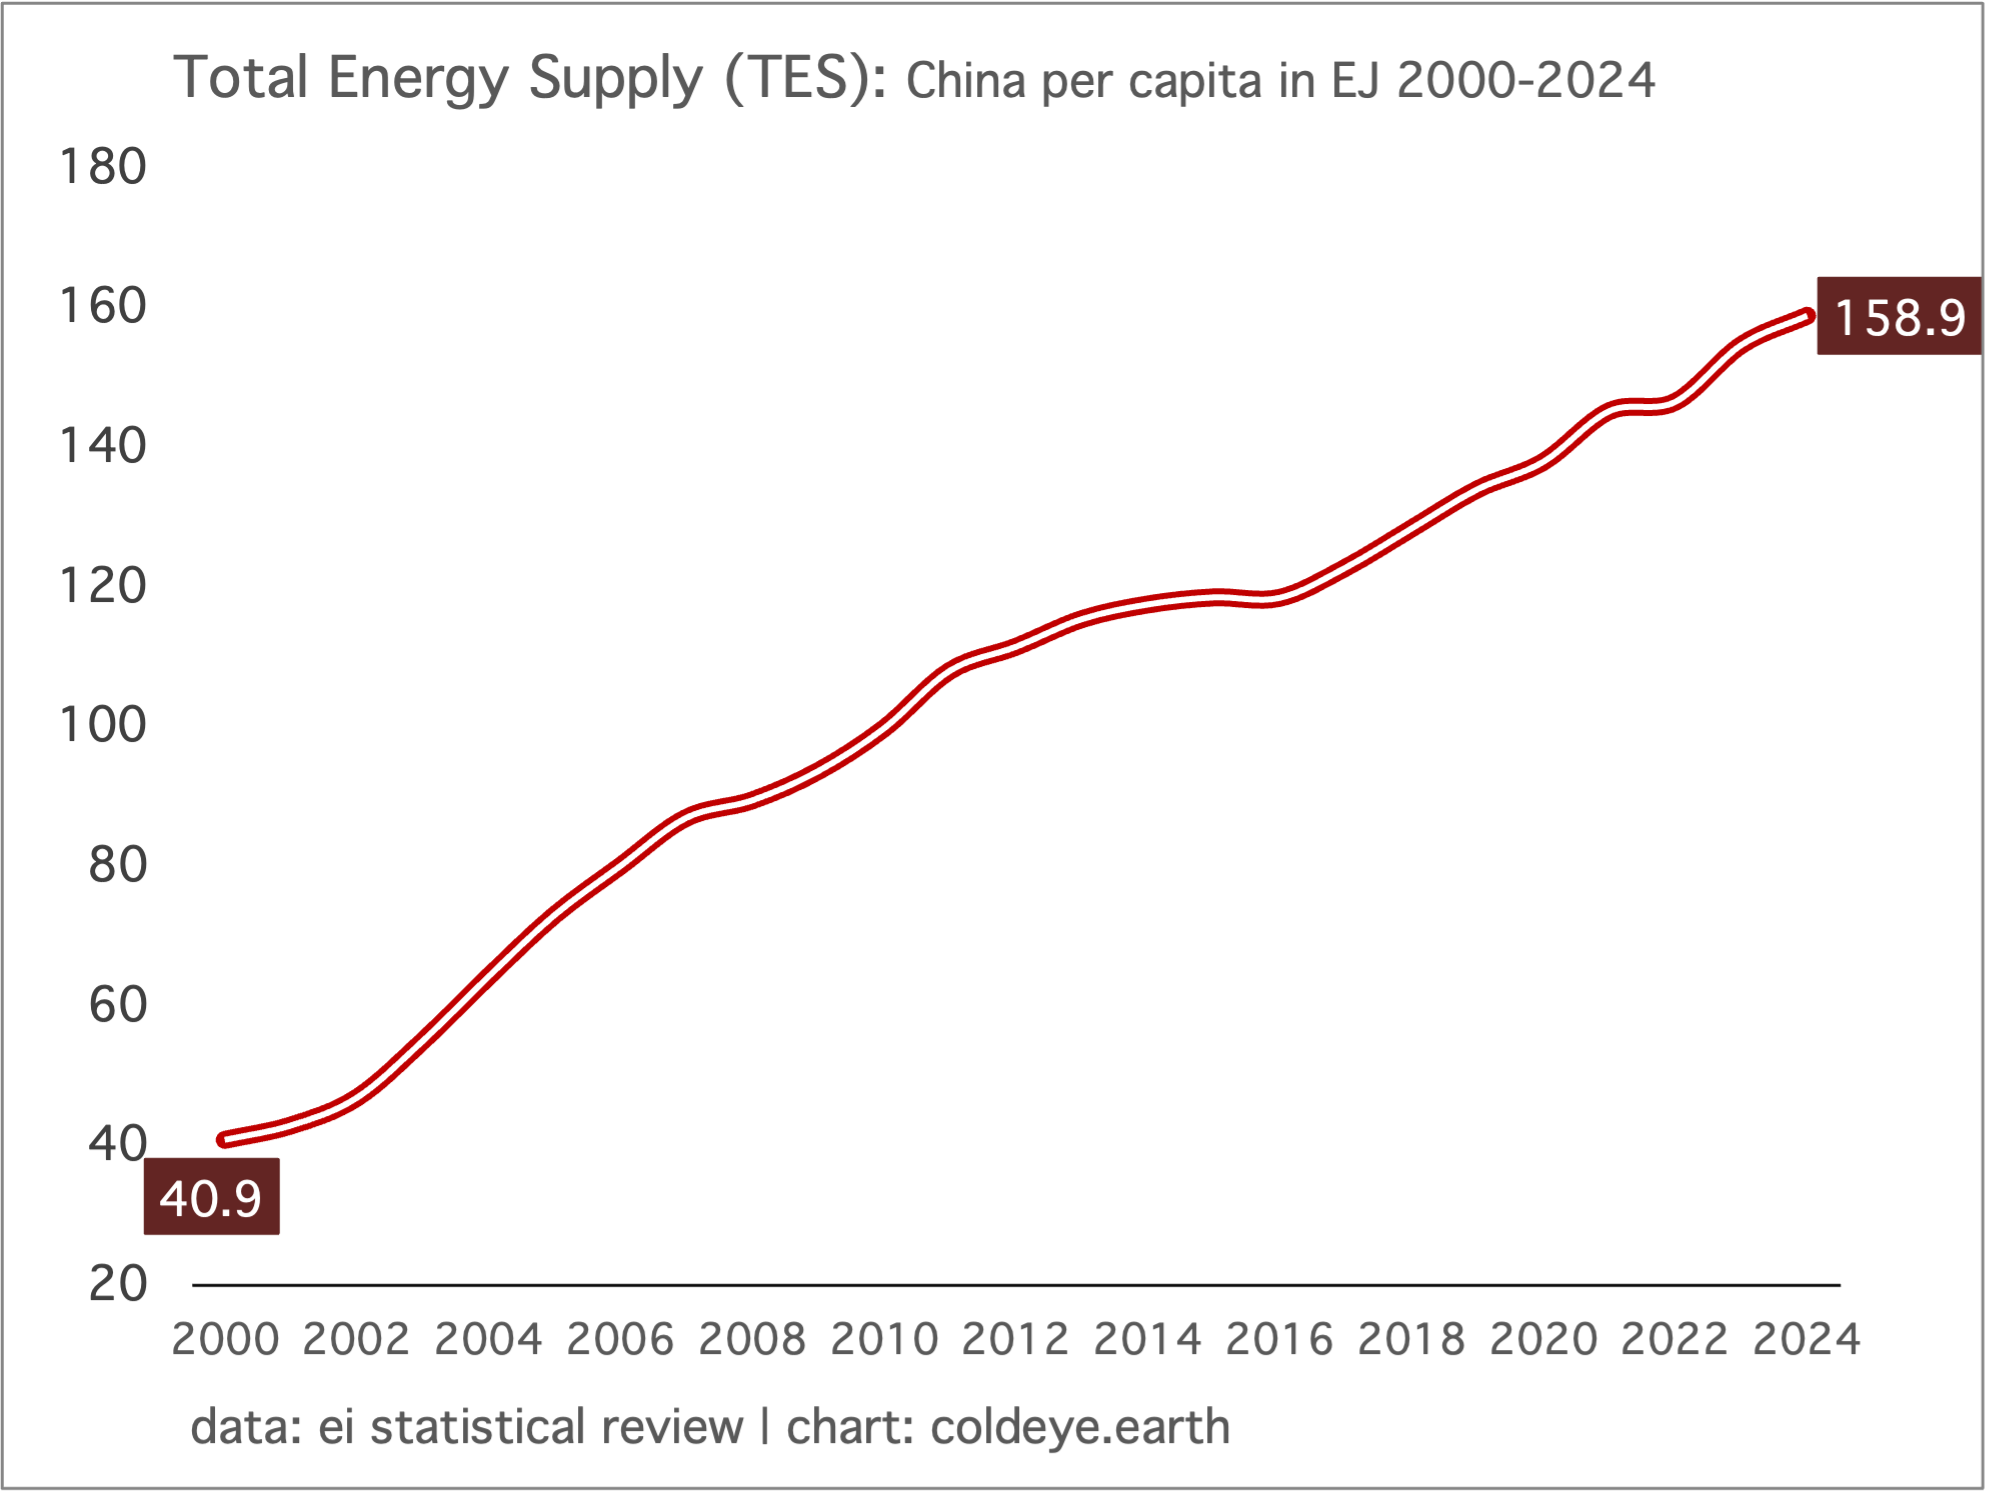
After WWII, the US began its own journey from manufacturer to consumer society. It seems unlikely that China will shed its industrial base, even slowly, over the next few decades but more important is that its domestic energy consumption per capita carries the risk—not the certainty, albeit—that it will simply keep pressing higher.
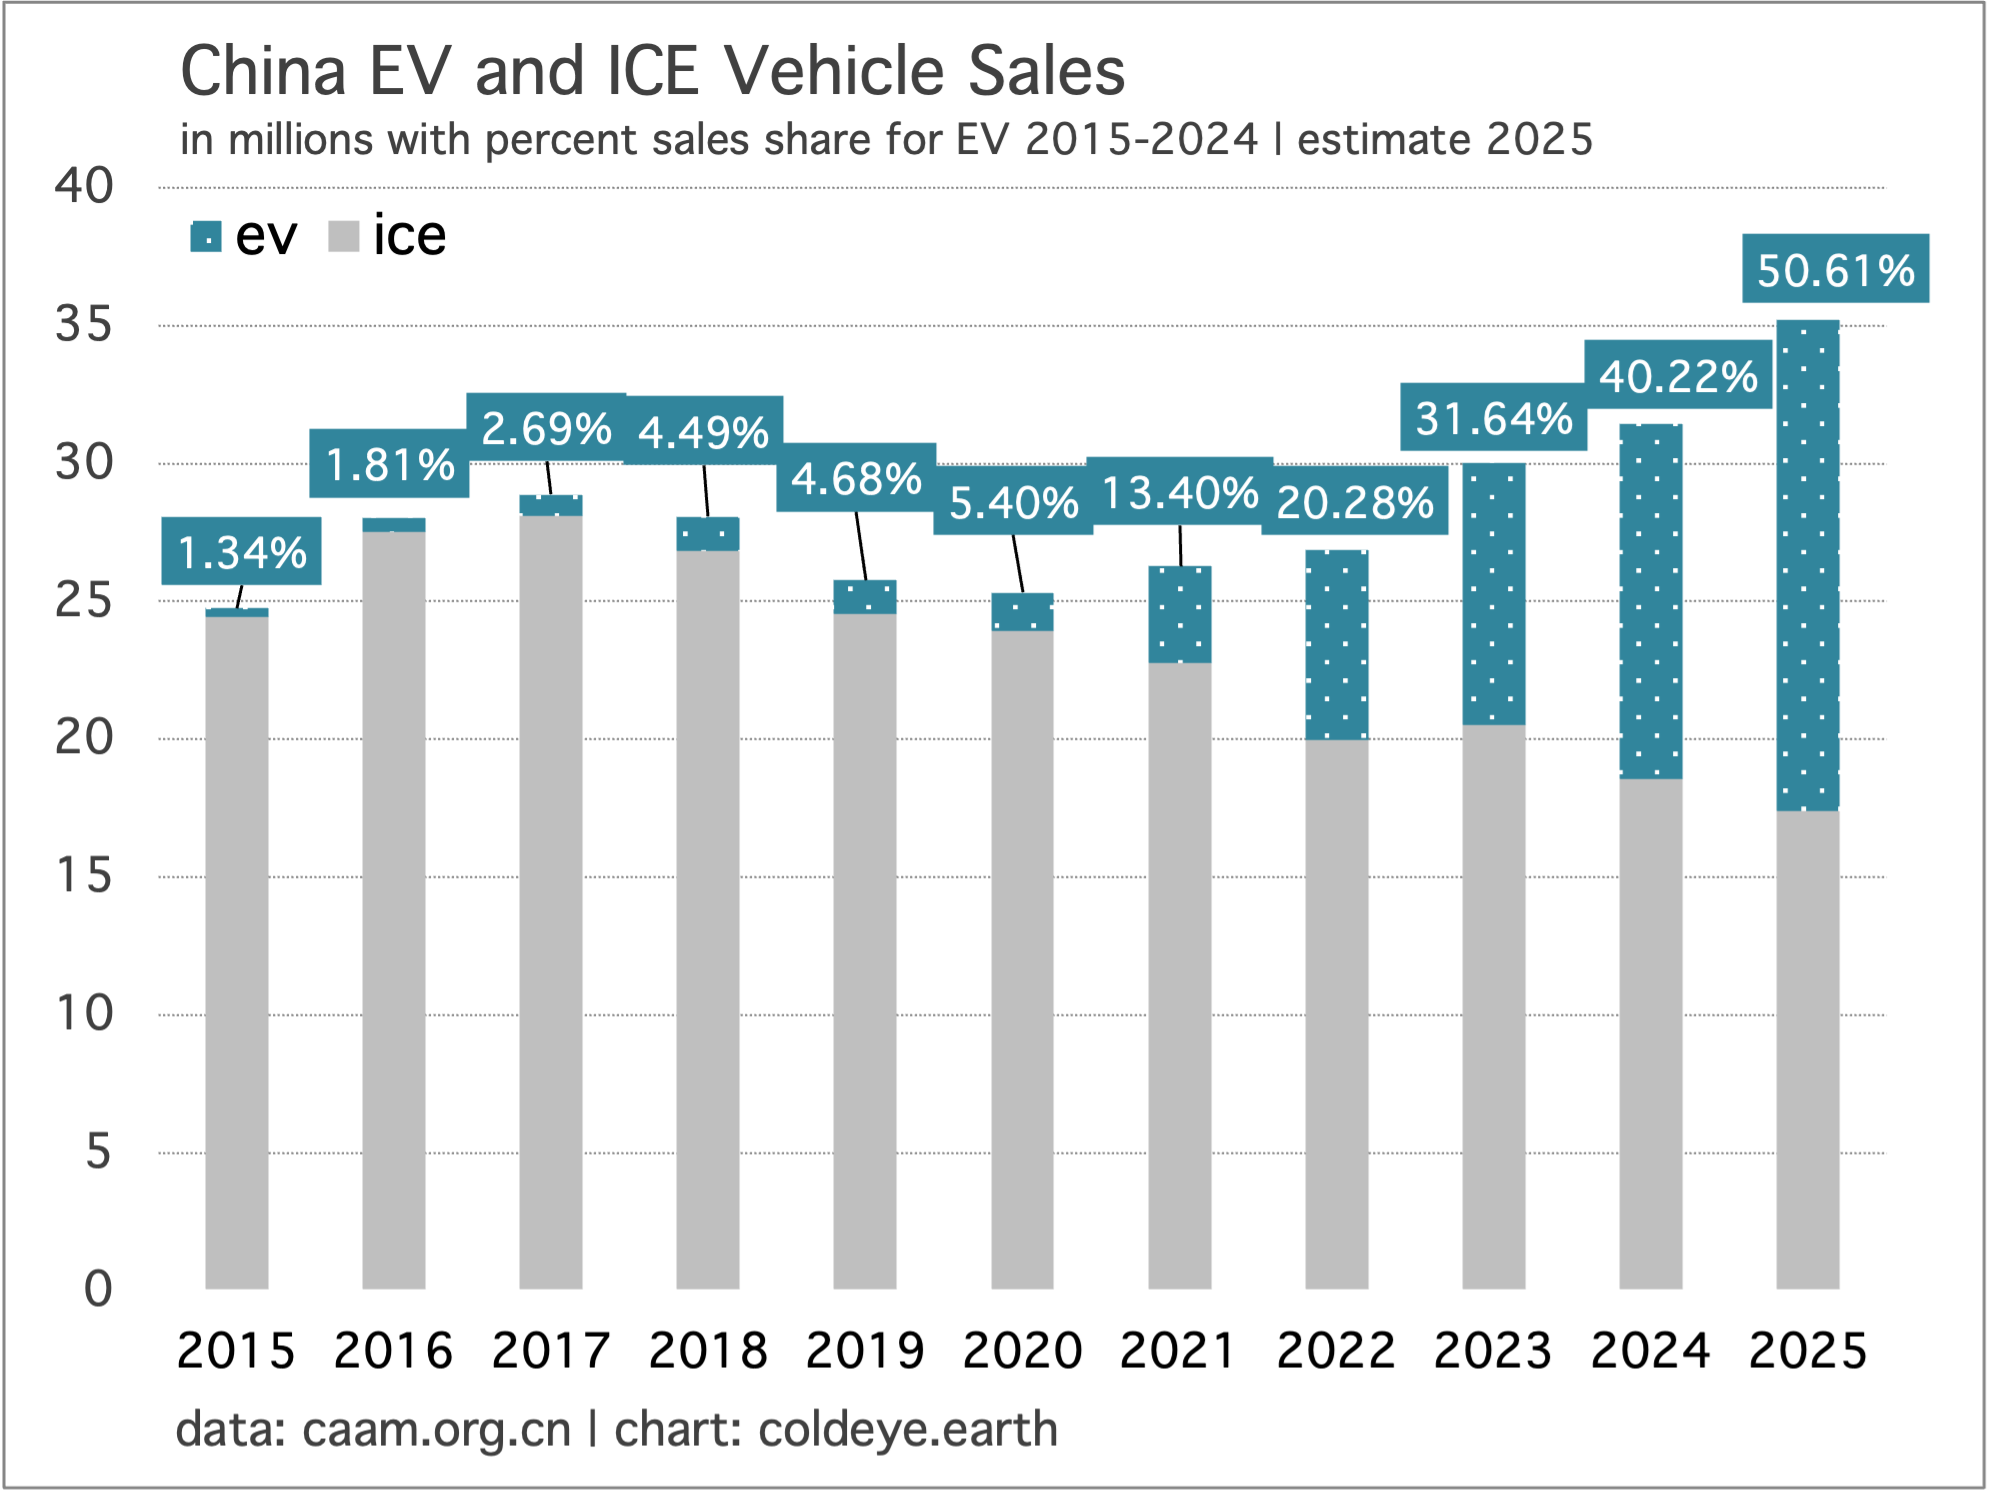
China’s EV sales are on pace to reach a full 50% of market share in 2025. We’ve known for some time that ICE sales peaked in 2017, so the future of ICE in China was set in stone some time ago. At current levels of penetration you may now assign the weak growth in China’s road fuel consumption to the EV explosion and congratulations are warranted. As a major importer of crude oil, China has significantly de-risked its oil exposure. Big picture: the lack of support for further oil demand growth in China is the key factor in oil’s dim outlook globally. In the chart below, data through July of 2025 has been annualized.
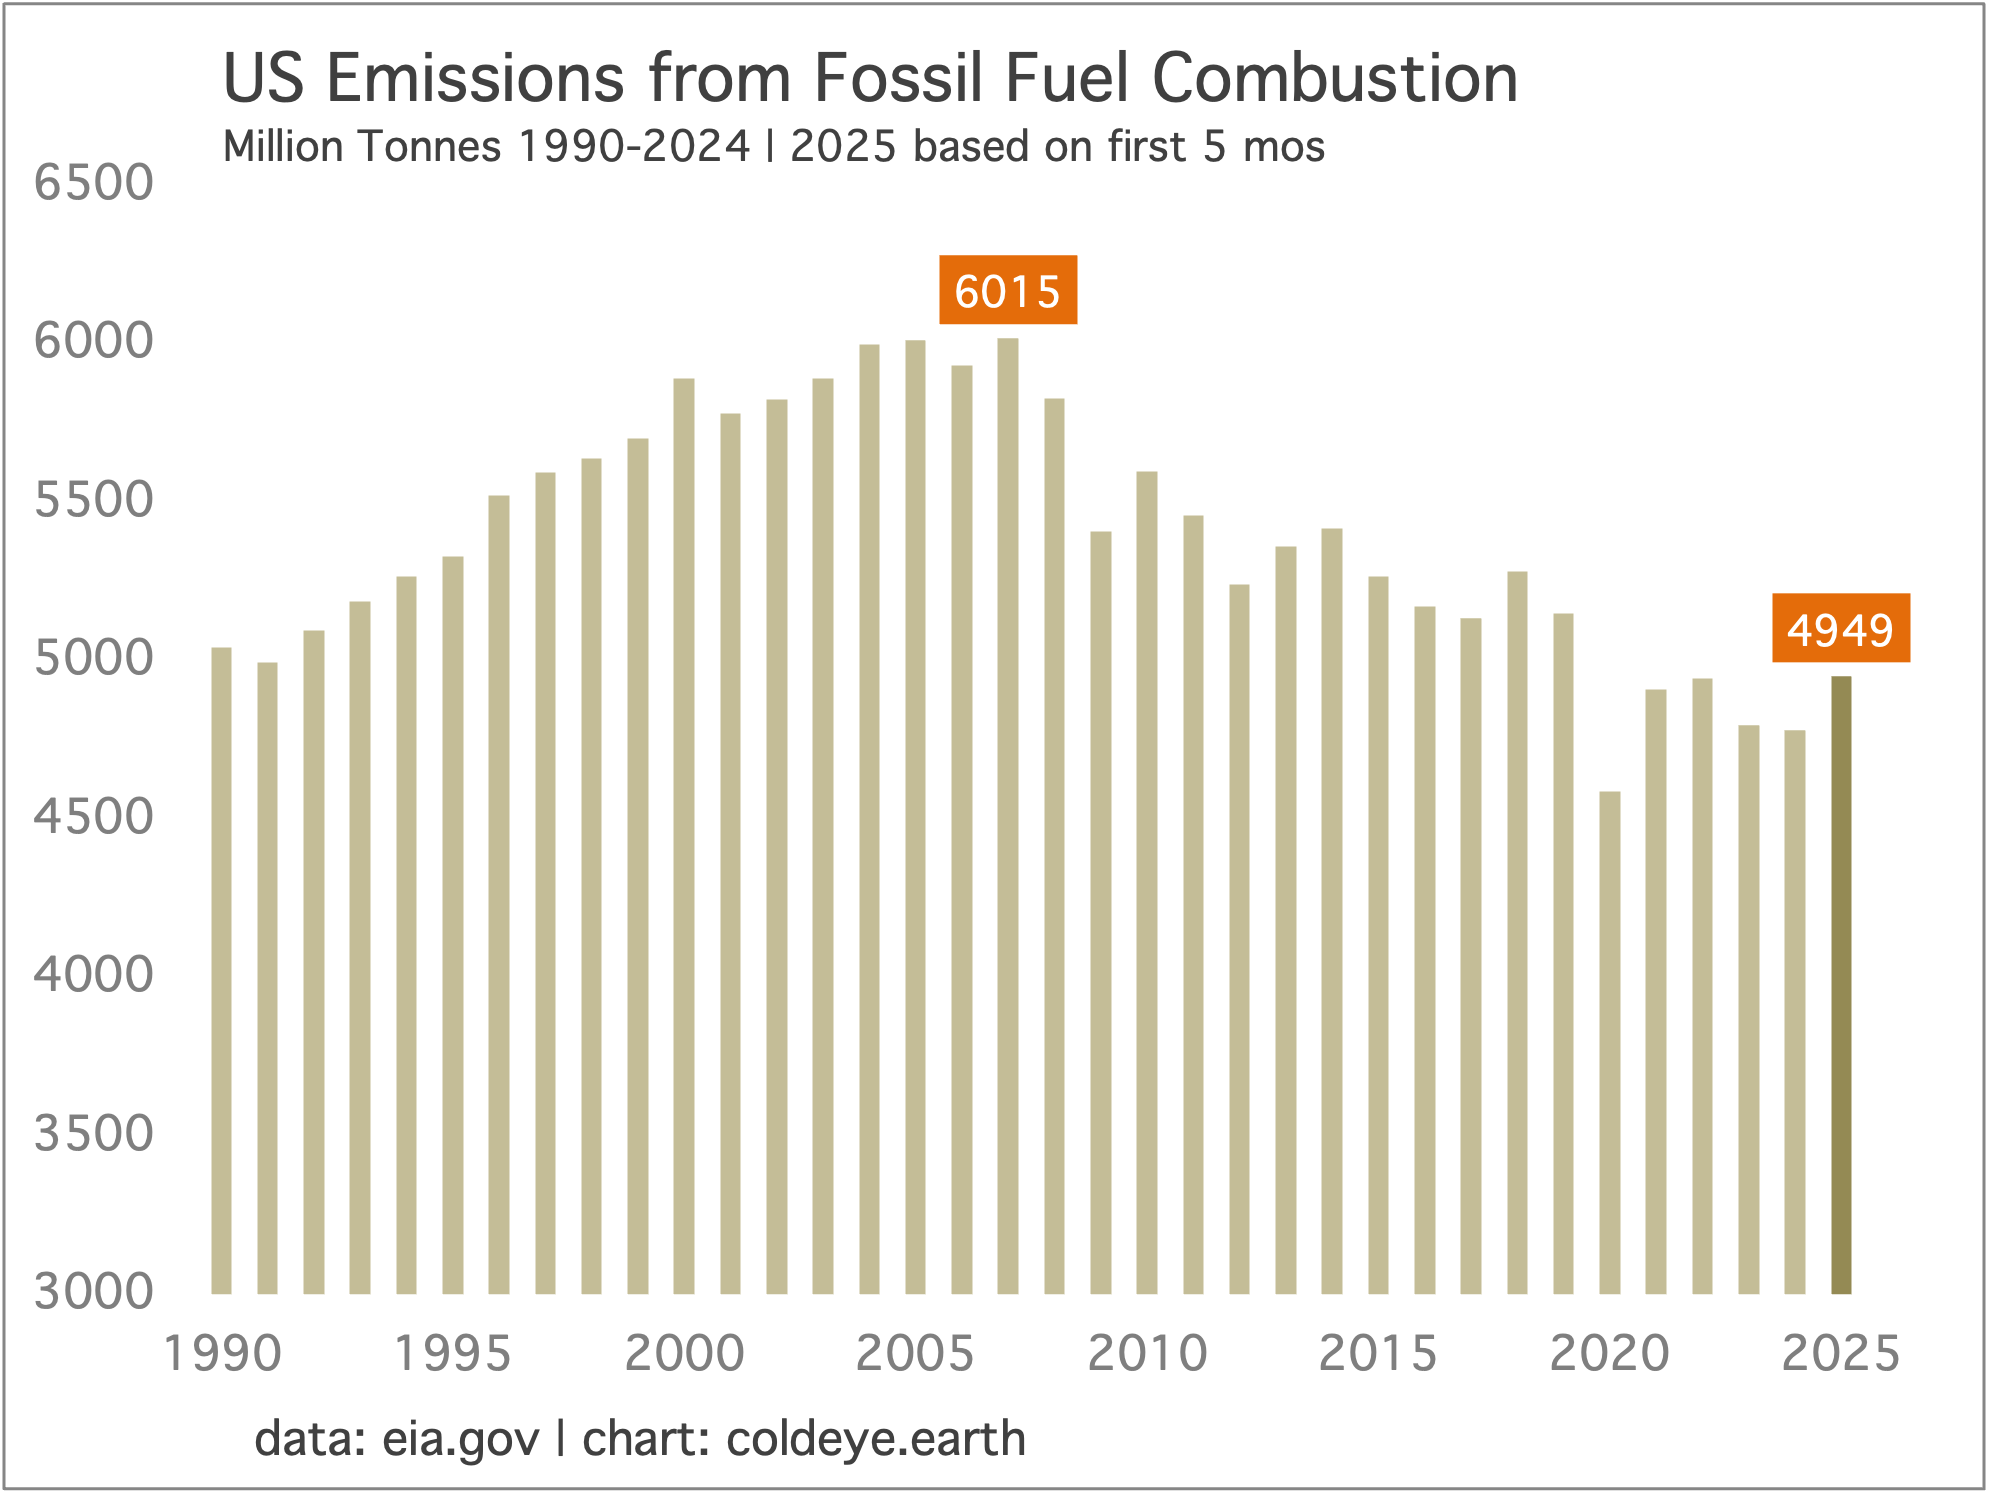
U.S. emissions remain on pace to rise this year, the first rise in two years, possibly by as much as 3.0% to 4.0%. Through the first five months of the year, emissions are up 3.6% compared to the same period last year. For the U.S., the emissions picture almost certainly worsens from here until a recession or a new administration with new policies.
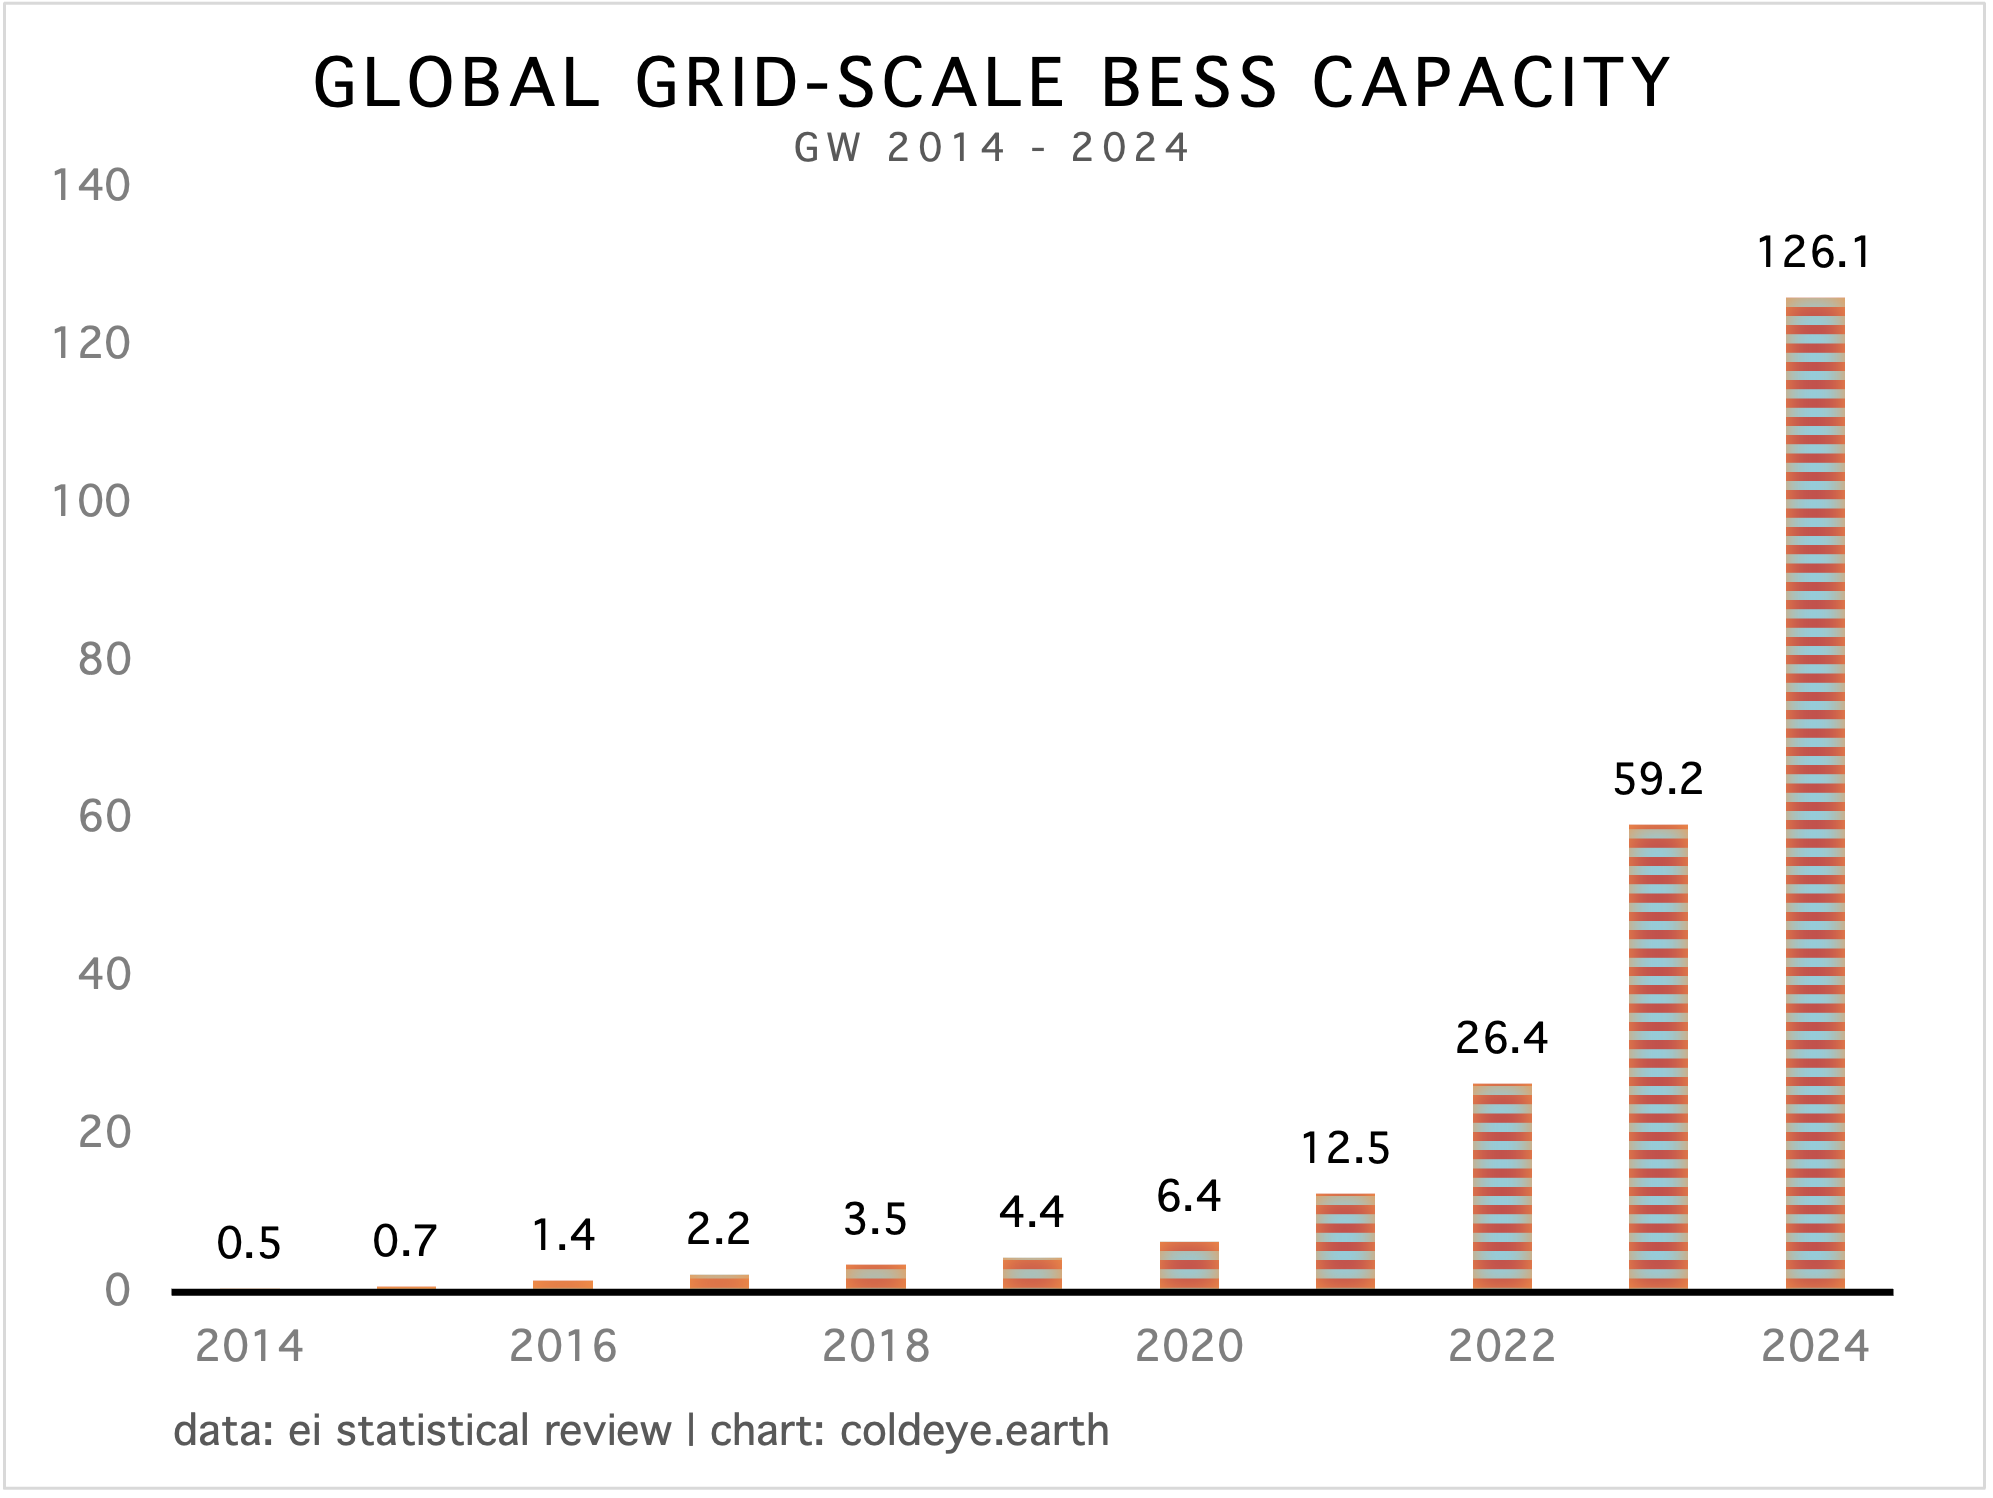
Growth of battery energy storage systems (BESS) is exploding higher. Estimates indicate the sector is up at least 50% through the first half of 2025, and that follows a nearly 100% advance last year of grid-scale BESS capacity. The most promising feature of BESS is that it adds value to every grid and every power source—with the exception, perhaps, of nuclear power which typically runs continuously about 95% of all the hours in a year.
Sometime this year or next, U.S. consumption of natural gas will overtake oil in energy terms. That will mark an historical pivot, as it was probably as far back as the late 19th century when American gas use eclipsed oil (we don’t have the data on that question, unfortunately). This harkens back to the “electrostate” discussion in the previous issue, and whether China is a true electrostate, or could the U.S. itself hope to fulfill that moniker. A likely outcome: China lapses into a similar long-term plateau of oil consumption that’s been witnessed in the U.S. the past twenty years, with occasional declines and recoveries as time goes by.
In the chart, U.S. natural gas use is now converging with oil at the 35 quadrillion BTU level. This confirms that even in the U.S., historically known for its mighty oil dependency, growth of the powergrid is how we tend to grow the economy now.
—Gregor Macdonald