
Boom Time
Monday 8 March 2021


Global oil demand remains on course to rise about 5.25 to 5.75 million barrels per day this year, according to the main agencies. The Gregor Letter however is increasing its own forecast from 5.75 to a 6.25 mbpd, and takes the view that OPEC, IEA, and EIA also will soon raise their forecasts. The world is heading for a major industrial recovery that will be larger, and arrive sooner, than financial markets are currently pricing. Vaccine distribution is accelerating in the US, and the current administration has just passed not a chopped down version of its $1.9 trillion pandemic rescue package, but a full one.
Economic recoveries rebound to the system we have, not the one we will have in the future. Accordingly, the existing vehicle and airline fleets will shoulder the imminent expansion, along with railroads, and other commercial vehicles of global trade. To be sure, now that electric vehicles are above a 5% market share in China, and a 10% share in Europe, economic activity will partly filter through those tranches of non-oil based demand. However, the second half of 2021 is likely to see strong excess demand in travel, and this will likely get started as early as Q2, especially here in the US. As The Gregor Letter has consistently pointed out, from a climate perspective, oil remains the most intractable problem to solve. Not coal. Not natural gas. Oil. And the 2021 global macro recovery will paint a stark portrait of this truth. While this year’s oil recovery will not resurrect demand to the 100 mbpd level of 2019, that is not the point. Rather, it’s the resiliency of oil, its ability to rebound consistently through global networks of path dependency that bears watching, and demands contemplation.

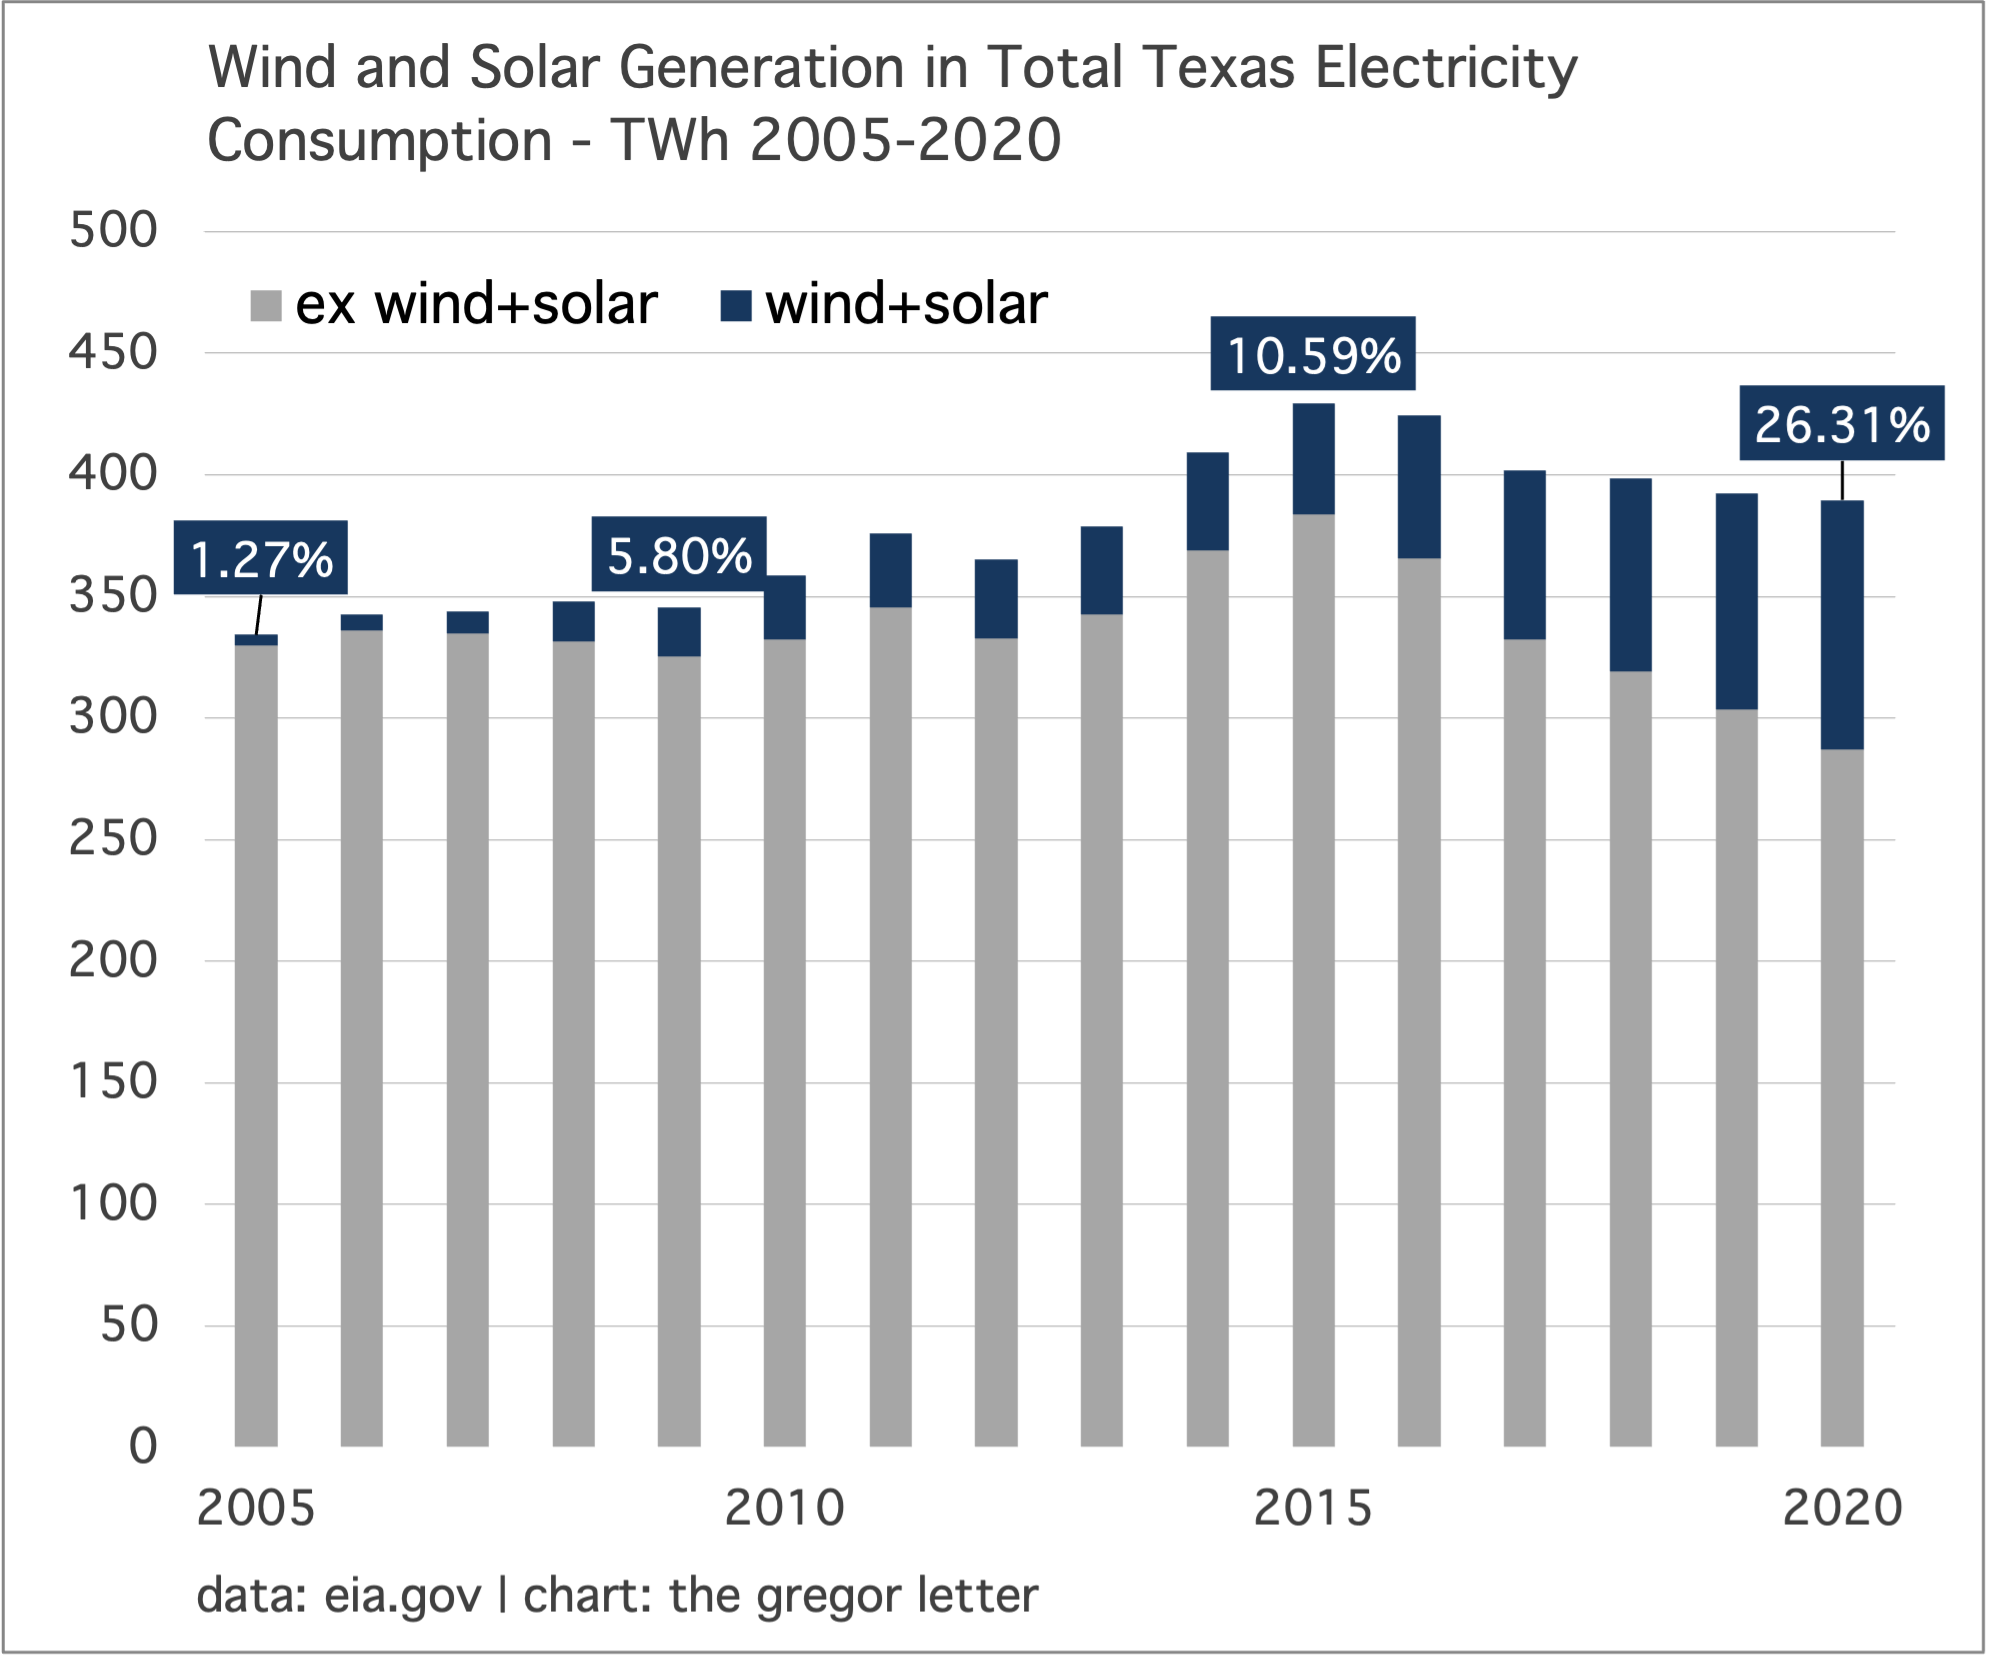
Texas overtook California in combined wind+solar’s share of state power generation. Broadly speaking, the two states are complimentary, as solar leads in California and wind power leads in Texas. But by last year, the two technologies were providing 24.9% of California’s electricity consumption, while accounting for 26.3% of Texas consumption. In the chart below, note how fast wind+solar’s share grew in Texas once crossing the key 5% level in 2009, and then especially after crossing 10% in 2015. Contrary to common perceptions, there were no barriers to further growth once wind power got “big” in 2010. And looking ahead, there’s much more to come in Texas. While California has been slower to add wind capacity to its leading edge solar portfolio, Texas is not hesitating to add solar to its massive wind portfolio. According to ERCOT, developers intend to add a massive amount of new capacity in just the next three years—much of it solar.
In California we have the perfect portrait of wind+solar’s takeoff point, after reaching the 5% share level between 2012 and 2013. By the end of 2014, the share had jumped to over 10%, and would double just four years later, by 2018. However, California’s wind+solar growth has slowed. Those big leaps seen earlier in the decade were due to utility-scale solar projects like Topaz and Desert Sunlight coming online. Since then, small-scale solar has taken up growth leadership.

Given the powergrid disaster in Texas last month—and the hapless effort to blame it on wind turbines—it’s amusing to say the least that the Lone Star State is mounting such an aggressive effort to build more wind and solar. Just to summarize, Texas wind power’s contribution to the energy system failure was statistically insignificant as the bulk of the state’s thermal power (natural gas mostly) failed as demand surged. Texas had ten years to contemplate undertaking the kind of weatherization of its pipeline system that’s common in other US states, and failed to do so. That’s partly why ERCOT is seeing mass resignations. In short, they messed up.
There is almost too much analysis of the event to fully digest, but this visualization from Brendan Pierpont, senior electricity analyst with the Sierra Club, showing the distribution of power plant failures is one of the best portraits you’ll find.
And just to say, grid level battery storage—which will certainly grow quickly in Texas in the years ahead—would have been enormously helpful in Texas during the blackouts. Would it have solved the problem statewide? No, but the expected flowering of interoperability between the grid, batteries, fleets of EV, and home batteries is inevitable and this will make powergrids far more resilient.

The Biden Administration is expected to advance the first of many offshore wind projects this week, as it pushes forward the permitting process for Vineyard Wind. Delayed by the Trump administration over the past few years, the offshore array will now use much larger turbines and fewer of them. That’s a portrait, in of itself, of how fast the technology is moving. According to E+E News, “Vineyard has also steadily reduced the number of turbines it plans to install, as the size of the individual turbines has grown. The draft plan called for installing up to 100 8-megawatt turbines. Vineyard's most recent plan calls for using 62 12-MW or 13-MW turbines.”

Vineyard Wind is slated to be a 0.80 GW project. And for context, the US currently has roughly 120 GW of installed wind capacity. But a new offshore wind energy industry along the east coast will build at least 30 new GW of capacity, and probably more. As the supply-chain comes together, as more ports are upgraded, and with a friendly administration in Washington, states are already expanding upon their previous commitments. There’s another easy projection we can make, too. Given that the annual distribution of wind power shows that generation tends to coalesce during off-peak hours (at night, basically), and given the population density of the US East Coast, it’s a safe bet that the region from New England to Virginia will be a fertile market for grid level storage.
The pandemic year unsurprisingly resulted in the greatest decline ever in global emissions. The data comes from IEA. While this is not news, it’s still useful to look at the composition of the declines, through the lens of fossil fuels. In short, we still live in an oil sensitive world, and great economic contractions hit oil the hardest. Not since the Great Depression has it been otherwise, for that was the last time coal took the biggest hit in a global downturn. Again, while obvious, oil remains the key unit of account for global economic growth—even in an era where its role is clearly diminishing. The pathway to eradicating coal has begun, and it has good visibility, for example. Global coal demand peaked in 2013, and has been on a rough plateau ever since. Finally, however, coal is ready to enter sustained decline.
But no such visibility exists yet for oil. I call this: the plateau problem. Oil has already entered its no growth phase, despite the fact that oil’s demand rebound will be exceptionally strong this year. But do not take comfort in the likelihood that oil demand won’t make it back to the 2019’s highs, just yet. Or, that oil will likely oscillate around those levels for years to come. Because outright oil demand declines will still be hard to achieve anytime soon, unless we do something about the existing vehicle fleet. Fleet turnover to EV, while encouraging, cannot by itself be expected to force global oil demand into sustainable decline until years from now. Yes, EV act already as a brake on oil demand growth—as do myriad other factors from efficiency, to changes in commuting and how we will work. Especially in a post-pandemic world. But it’s only 2021, and while oil has hit its first big hurdle—the end of growth—population growth and economic growth will support oil for years to come.

Coal in US power generation fell by 58% over the past decade, and now accounts for just 19% of US electricity. When fossil fuel demand growth eventually rolls over from a plateau, the declines can be rapid. US coal is now following the path UK coal. But consider that even a decade long decline in US coal (one of the top 5 world users) was still not enough to pull global coal demand down from a flatline for at least 6-7 years, starting in 2013. These are classic large system dynamics that are long familiar in path dependency, and also growth. A basic principle: it can take many years for a new technology to finally poke its head above 1.00% of market share; and, it can take many years for a dominant technology to enter outright decline, even as its growth prospects erode. In the chart below, we are at a much later stage in this dynamic, as the incumbent energy source in US electricity is at an advanced stage of superdecline, and the new technologies are unstoppable.

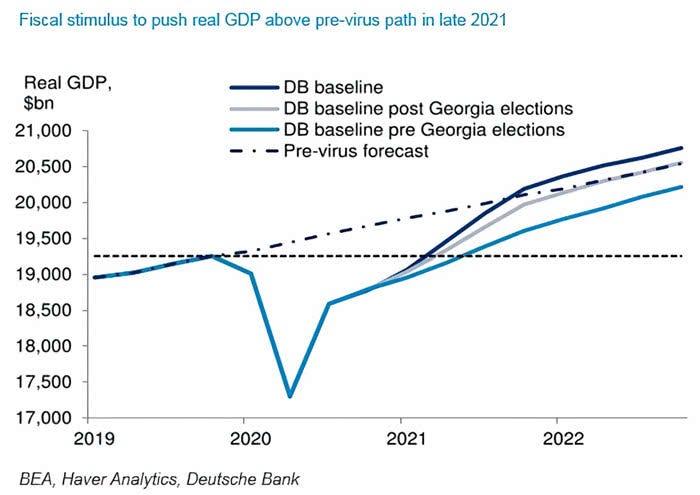
Faster than expected vaccine development and vaccine distribution, combined with a spectacular pandemic recovery package from Washington, points to a much stronger global recovery. While many may assume an improving economic outlook no longer counts as news, and has been expected for several months (at least since the US presidential election), markets have probably not yet discounted a very large extended cycle that endures for the next 3-4 years. Some examples. Only three months ago, it seemed a stretch that SP500 earnings would match 2019’s $163.00 anytime this year. Now, consensus earnings have risen to $174 for this year, and $200 for next year. That seems much closer to the recovery’s plausible pathway. Why might that be? Because the magnitude, but also the breadth, of the US fiscal package shifts the trajectory of GDP growth. Substantially so. This week, Deutsche Bank’s latest US update indicates a major revision: GDP is now expected to rise above the pre-pandemic pathway before the end of 2021. As recently as last quarter, no economists expected such an outcome for this year, and most had placed such a trajectory on course for next year—or even 2023.
It’s also now clear that, in classic fashion, a new global auto cycle is underway. To remind, the last one peaked across 2016 and 2017, so we are in the right timing band for a new one. Share prices of Ford, GM, and Volkswagen are also not merely indicating the new cycle has begun, but are reflecting further that EV market share is about to become more widely distributed, with the legacy automakers contributing. Both Ford and VW are now eating into Tesla’s market share, and Volkswagen’s stock price is up +23.6% year-to-date, well outpacing its home country index, the DAX.
While this recovery will rebound to substantial fossil fuel consumption, it’s important to remember that economic momentum also favors new energy infrastructure deployment as capital flows more quickly, and supply chains are resurrected. We can think of the new offshore wind industry in the US as a decade-long construction project on a fairly grand scale. Global deployment of both wind and solar will likely hit the optimistic forecasts, as demand returns and grows more quickly.
The global economy therefore is heading towards something substantially beyond a mere “reopening.” That particular version of the recovery held that we would slowly work our way back to the previous growth trendline perhaps by mid to late 2022, with labor markets roughly doing the same. But that was before the astonishing help in the form of direct cash payments to Americans. Including last year’s stimulus checks and unemployment premium payments—and now this year’s versions of the same plus a generous child tax credit—an average family of four in the country may receive as much as a $50,000 premium over the historically low level of unemployment relief, in the course of one year. That’s looks a lot like an experimental version of UBI—universal basic income. Here is an astonishing graphic from the Washington Post:

We now have the happy prospect that consumers will be armed with cash, even as they return to work. And the American Relief Plan (ARP) has a slew of other measures to help cities and states get back on their feet too—that will translate directly into rehiring of many public employees. This VOX article published over the weekend is a good overview of the ARP’s most important provisions.
Finally, there are significant political implications to the stepped up path to recovery. The convergence of vaccines, stimulus, and reopening on a global level means the economy is almost certain to be booming by next year’s US midterm elections. As readers know, Democrats lost seats in the US House of Representatives in 2020 after their blue wave victories in 2018. And historically, the President’s party loses more seats in the first midterms of a new administration. But a booming economy is likely to turn those dynamics upside down, especially after the suffering of a global pandemic. Accordingly, the risk that a series of policy changes would derail Biden administration efforts on renewables and climate policy is now dropping. Those risks may rise again for reasons we cannot foresee. But until they do, the Biden administration and the Democrats probably just charted their own course, their own destiny, for the next four years.
—Gregor Macdonald, editor of The Gregor Letter, and Gregor.us
The Gregor Letter is a companion to TerraJoule Publishing, whose current release is Oil Fall. If you've not had a chance to read the Oil Fall series, the single title just published in December and you are strongly encouraged to read it. Just hit the picture below.
