
Changes vs Levels
Monday 15 June 2020


China’s vehicle market is rebounding strongly from the February lows, but remains on course to be down significantly for a third year. China’s total market, including passenger cars and commercial vehicles, peaked in 2017 at 28.879 million sales. But the market subsequently fell to 28.081 million in 2018, and lurched downward last year to 25.769 million. According to industry forecasts, the market will fall greatly again this year, by roughly 23%, to 19.842 million. Indeed, sales in the first five months of the year totaled just 7.931 million. This potentially confusing portrait—a market recovering strongly from extreme lows, but one still mired in steep decline—demonstrates the importance of distinguishing between changes and levels, a concept that will dominate all economic data, over the next two years.

Electric vehicle sales are not rebounding well in China this year, but are faring much better in Europe. Within China, sales of NEV (new energy vehicles) are down 39.7% through the first five months while the entire market was down 22.6% in the same period. In Europe, however, electrics and other plug-ins took a huge 17% share of the EU market in the month of April. And for all of Q1 electrics rose 57% over the previous year, even as the total market was (unsurprisingly) crushed. Meanwhile, as the EU auto sector continues to gear up to produce EV at faster pace, VW had a setback this week, grappling with a familiar problem facing modern cars: software.

California’s vehicle market is expected to fall by 25%, from 2.09 million units in 2019 to 1.54 million this year. The forecast comes from the California New Car Dealers Association. Recent trends haven’t changed that much, however, despite the market slump. Light truck sales fell less steeply than passenger cars, for example. And while we don’t have a full picture of California EV sales, the brand that dominates the state’s EV market, Tesla, posted a 9.3% increase in Q1 2020 vs Q1 2019. Just to remind: now that EV (pure electrics and other plug-ins) have reached above 8% of market share, ICE vehicles must now be regarded as the legacy technology in California.
Consumer spending rose strongly off the March/April bottom, but remains well below pre-pandemic levels. Moreover, the rate of recovery in spending is starting to slow. The data comes via Opportunity Insights at Harvard. In the chart below, I chose three big states, Florida, Texas, and California to compare against the national average. If you’d like to play around with the data yourself, choose the “explore the data” button on Opportunity Insight’s economic tracker.

The May jobs report unleashed quite the surprise, when data showed that jobs actually rose during the month. The outcome is due to a variety of effects, unique to the sudden nature of the crisis. Mostly, analysis has centered on the extreme difficulty of job status classification during a time when payrolls have been supported through targeted government programs. Heather Long, economics correspondent at the Washington Post, has the details. Also at the Post, Catherine Rampell, posted a chart emphasizing the very small blip which constituted job growth, for May:

Finally, Justin Wolfers, economics professor at Michigan, made the following point: even though the headline unemployment number was posted at 13%, in his view journalists should report a 16% unemployment rate given the technical difficulties acknowledged by the BLS. The start of the Wolfers thread can be found here, but I pulled the key segment below:
The next wave of COVID-19 is now underway globally, and it appears the United States will join in, playing a supporting role. The latest advance in confirmed cases conforms to the multiple wave model, in which human behavior—the serial loosening of restricted movement after each outbreak is moderately suppressed—grants the virus renewed opportunities to spread. Meanwhile in the US, several states which had previously congratulated themselves on busting virus growth are now seeing case counts breakout to new highs. Texas, Arizona, North Carolina, South Carolina, and Alabama have all been making new highs in case counts, and the fresh trend higher comes about one month after many US states started to re-open. The COVID Tracking Project notes that Texas, Arizona, and North Carolina are also seeing new highs in hospitalizations.
Florida in particular merits some citation. After a highly politicized and boastful re-opening that occurred in the first week of May, case counts began a new uptrend starting one month later. Here is Florida now, six weeks later.

There’s a common intuition that a two-week timeframe is all that’s needed to test whether a broad loosening of movement will produce increased case counts. That probably comes directly from the 14-day experience, at the individual level. But to get case counts rising again across populations, it appears that four to six weeks is the more typical timeframe.
Finally, there’s a counterpoint case to the question of re-opening: California, which not only endured very restrictive lockdowns, but surprisingly never broke virus growth sustainably like other domains. Now, California’s case count is not only making new highs, but is in the grip of a powerful uptrend.
The stock market will have to contend not only with the pandemic’s next wave, but the uncertainty surrounding the fiscal response. Tom Gara, opinion editor at Buzzfeed, wrote a big picture piece laying out the sequence of cliff-edge moments approaching later this summer as programs for income support, loan forbearance, and state fiscal help are set to expire. At the moment, it is genuinely unknown how Republicans in Congress, and the White House, will gauge the risk and reward of further fiscal help. The signals coming from both Congress and the White House are already quite mixed. GOP leadership has started to send out a wait-n-see signal, deferring further stimulus questions to the end of July. And White House economic advisor Larry Kudlow said over the weekend that the $600 supplementary checks, that ride on top of regular unemployment compensation, need to stop. The market is going to react to such uncertainties.
Despite the oft heard refrain that “the stock market is not the economy,” both changes and levels in the market are significant inputs to the economy, especially during a crisis. The Federal Reserve’s decision to purchase corporate bonds has no doubt had a powerful effect on stock prices in the past month. But Thursday’s violent market reversal contains a warning: what happens to confidence if markets plunge again, despite the backdrop of such ongoing monetary support? As the next wave of the pandemic rolls through, it will be as important as ever to extend fiscal support. Not doing so will reveal the gaping holes currently operating in the economy. And the market will react. Coda: Tom Gara was sadly laid off from Buzzfeed, as part of the recent wave of furloughs and job cuts in the industry.
There is still no change to The Gregor Letter base case. The base case assumes that populations eventually get smarter, however, and accept the inconveniences of face-masks, testing and tracing, and other protocols that reduce the size of subsequent waves. It is regrettable, but also a portrait of human psychology one should never forget, that so many allowed themselves to assume the pandemic was a one-and-done type of affair.

Minor adjustments to 2020 full year oil demand forecasts continue, but consensus is starting to form around a decline between 8-10%. Where the Gregor Letter slightly differs is in the assumption about subsequent waves of the pandemic. So, if EIA Washington and IEA Paris have started to settle on an 8.5% decline, that is probably the “under” at this point. N.B. 2019 consumption largely resolved around 100 mbpd, thus making 2020 declines measured in either barrels, or percentages, easy to understand.

US gasoline consumption has recovered nearly 50% of its decline. The way forward however is less clear. Given the long-term pressure on air travel, and now that work-from-home practices are becoming institutionalized, the prospect for further recovery in oil consumption is cloudy, at best. As I wrote in the 18 May newsletter:
Something to look out for in the days ahead: in any data series, watch for the tendency of many recoveries to claw back 30-40% of the losses, only to then stall out. This, unfortunately, is the outcome that may define our fate over the next year or two.
The recovery in global oil prices has also stalled out in the past week, after WTI nearly hit $40.00 in early June. In a sign of the long-term difficulty facing the aerospace industry, Precision Castparts—a Warren Buffet owned company, based here in Portland—just announced a significant round of layoffs, the largest to date in the Oregon manufacturing sector. Data: you can follow the weekly gasoline consumption data yourself, at the bottom of this EIA tracker page.
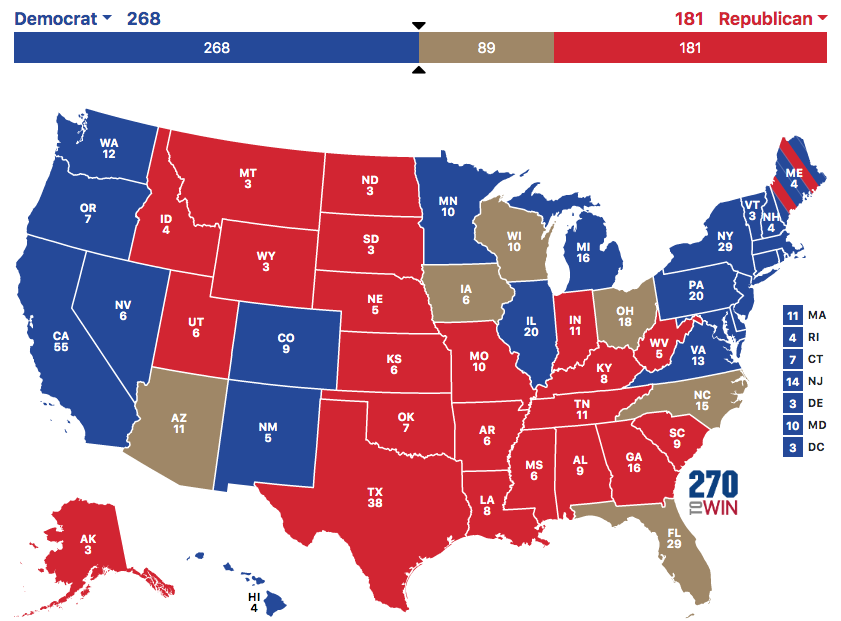
Presidential approval readings and November election prospects for President Trump are cascading downwards. Veteran pollster Charlie Cook, after seeing the latest Gallup poll, simply asked, “have you ever seen Presidential approval drop by 10% in a month?” On my latest electoral college map, I have awarded Biden all the states that Hillary Clinton won in 2016 (which is very much a conventional view) in addition to winning back Pennsylvania and Michigan. By doing so, the Democratic nominee (Biden) needs only win one additional state to push past 270 electoral votes.
But in addition to the national polling on the race itself showing Trump potentially getting entirely blown out—The Economist with an 8% Biden lead, Harris with a 10% Biden lead, and CNN with a 14% Biden lead— there are key proxy races now sending out warnings that are at least as dire for the President. If not worse. For example, Senate candidate Mark Kelly from Arizona has a double digit lead against Martha McSally, who has been a loud and constant supporter of the President. This suggests that Arizona itself is (incredibly) now within reach of a Biden win.
But the loudest signal has to be a just released, high quality Selzer/Des Moines Register poll showing first term Iowa Republican Senator Joni Ernst trailing 3 points to a virtually unknown newcomer, Theresa Greenfield. This is astonishing on two levels. First, Iowa in recent Presidential elections has turned deep red in favor of Republican Presidential candidates. How red? Trump’s margin of victory in Iowa in 2016 was slightly greater than his margin of victory in Texas. Moreover, even during the worst of the trade wars, which hurt agriculture badly, Iowans very much stuck by the President. So a dramatic change in voter attitudes has clearly taken place in Iowa. Second, Greenfield, who is a true newcomer, would in any normal period in US history be quite challenged to run for state office, let alone national office. That she’s in the lead, even by a small amount, is an unequivocal signal that Ernst is now a proxy for Trump, and the newcomer is a proxy against Trump.
And yes, the details on that support are even worse for both Ernst, and Trump together. In a complete upending of the 2016 Trump phenomenon, Greenfield the newcomer is ahead of Ernst with non-college educated white women by 31 points. For those of you outside the country, let me frame the Iowa race in the following way: if you tell me that Joni Ernst manages to fend off the newcomer this November, but does so by squeaking out a tiny victory, by 1-2%, then I can tell you with confidence that Trump has lost the election nationally.
—Gregor Macdonald, editor of The Gregor Letter, and Gregor.us
Photos: 1. Visualizing Sound, an art installation by Daniel Palacios, circa 2010-2012. 2. Interstate 5 interchange and off-ramps, Portland, Oregon, 2020, Gregor Macdonald.
The Gregor Letter is a companion to TerraJoule Publishing, whose current release is Oil Fall. If you've not had a chance to read the Oil Fall series, the single title just published in December and you are strongly encouraged to read it. Just hit the picture below.
