
Concentration Risk
Monday 24 November 2025


In its latest World Energy Outlook the IEA reopened the door to continued growth of global oil demand. This is a change from their outlook of the past few years, to be sure, where they, like others, forecast little to no demand growth after 2025. In the opinion of Cold Eye Earth, however, we shouldn’t be too alarmed by the IEA’s shift in posture. After all, it’s just one of their scenarios (current policy scenario, or CPS), and in this latest CPS, oil demand continues rising—by an aggregate 13% in the 26 years from 2024 to 2050. Looked at more closely, that’s a scant 0.5% of growth per year until midcentury. And it’s probably not a coincidence that this tracks with the sub-1% growth that oil is experiencing lately.
Readers will recall it was British Petroleum that first made the big call on “scant to nil” post-2025 demand growth, way back in 2019. And since that time, a number of analysts have gathered around this year as a pivot point. Why is the IEA suddenly so alarmed? It’s not clear. But here is one possibility: The effort to stop oil demand growth requires intense effort, and in recent years China has led that effort valiantly, followed by a solid and ongoing effort in Europe. But North American EV adoption just isn’t that great, and the current administration is of course doing everything possible to return oil to a stronger position not just here in the U.S. but in this entire hemisphere . If we examine a related IEA chart, "Global new car sales by drivetrain,” one can see how although ICE vehicles globally peaked years ago, around 2017, the rate at which we stop buying ICE altogether and increase purchases of EV still matters.
Here, meanwhile, is the fossil fuel chart from the IEA, “Oil and gas demand do not peak,”revealing their shift in the CPS.

You will also note that the IEA sees no peak for natural gas, either. That particular aspect of their forecast looks more solid. Gas has two things going for it. (1) As a partner to variable renewable sources, gas greatly helps the balancing-needs of global power grids—and that will be true even as battery energy storage systems (BESS) continue to grow. (2) In its competitor role, gas has sustained a strong, ongoing capability against coal, and much of the global natural gas fleet is young.
Indeed, the favorable growth prospects for natural gas offer additional help in understanding why growth prospects for oil are so poor: In global transportation, there remains oil dependency but not oil growth. And outside of transportation, whether it be chemicals or an array of industrial applications, there’s simply not enough organic growth to offset oil’s poor prospects.
While we want to be cautious about using the signal from oil prices to strengthen the argument against (much, if any) oil growth in the future, it has become difficult to ignore that the global oil complex has been building inventories, growing spare capacity, and suffering the low prices that inevitably follow those emerging conditions. For at least a year or two now, it’s also been possible to declare that oil prices, on an inflation-adjusted, basis are dirt cheap. Oil was at one time considered an inflation hedge, and for short periods oil may still retain some dwindling qualities under those circumstances. But it’s pretty shocking to see oil at $60 a barrel in the year 2025. That’s after 20% aggregate inflation since 2019-2020 or so, and doesn’t even include the inflation from the previous 20 years. Oil prices first reached $60 a barrel in 2005!—which shocked people and rightly so. But $60 oil in 2025 is little more than a pale, thin shadow of those go-go years.
To be blunt: Today’s oil prices do in fact indicate that demand absolutely sucks, and the futures market (which is not infallible) doesn’t see that changing. It’s also fair to say that the IEA often makes new shifts and declarations right around the time the trends they are seeing reach their apex. To be sure, the Crazy Ivan move in the U.S. toward fossil fuels has been jarring, and the importance of the U.S. in these equations no doubt adds to the overall dark vibes about energy transition in general.
Presently, according to the IEA, global oil demand is on course to advance 0.7% in 2025 and by a similar percentage next year. But overall, oil demand has grown only 3.2% in the aggregate in the five-year period from 2019 through 2024. From a climate perspective, the central problem that oil presents, therefore, is not that it’s going to keep advancing, but rather that it’s just not on course to decline.
The IEA has of course updated their other main scenario, the Stated Policies Scenario, or STEPS, and that has led them to muse and speculate over various peaks. Cold Eye Earth likes this scenario much better, and overall it seems more in tune with current trends. (Indeed, the CPS increasingly looks like a rearguard move by the IEA that gives them credibility in case “all this energy transition stuff” doesn’t work out very well.) For example, in the STEPS, oil demand stops growing around 2030; natural gas reaches its maximum level ten years from now, around 2035; nuclear generation finally grows again on a sustainable basis; and coal keeps going for a while but really starts to fall off hard by 2030. You can see all those projections in the chart below, also from the IEA’s 2025 Outlook.

It’s no surprise that nuclear fares so well in the STEPS. Nuclear is the perfect example of a technology that truly lives and dies on the back of policy changes. And yes, that remains true even if you posit that the new wave of SMRs comes to fruition. Everyone is aware that many countries around the world are coalescing to promote a nuclear revival, but to achieve the IEA outcome shown here will require countries to actually follow through on their plans.
Coal, meanwhile, and the decline the IEA forecasts, is therefore the shadow of these nuclear plans. The titanic ascent of wind, solar, and storage—along with natural gas—has certainly helped to blunt coal growth. But to trigger actual declines in coal will require all the current effort plus something extra—like nuclear—to force coal consumption to a final tipping point.
A final thought: Cold Eye Earth remains allergic to the common assumption that peaks convert quickly to declines. They don’t. However, we should keep an open mind for the possibility that some fossil fuels, like coal, could actually not just decline but fall off a cliff as the encirclement of gas, renewables, and nuclear reaches critical mass.
Wealth and income inequality are back on the front page as public figures race to converge on the issue of affordability. The tip of the spear in current discourse appears to be centering around the election of Zohran Mamdani for New York City mayor after he ran a campaign absolutely laser-focused on affordability, while at the same time President Trump has run into deep trouble in voter popularity as the public has decided his administration not only messed up but is now gaslighting everyone about its record on inflation. A fresh CBS poll released on November 23 showed that the public has now essentially transferred its ire—once trained on Biden and the last administration—to Trump. And so Trump is now the punching bag for the fact that prices are either still going up or are already unaffordable.
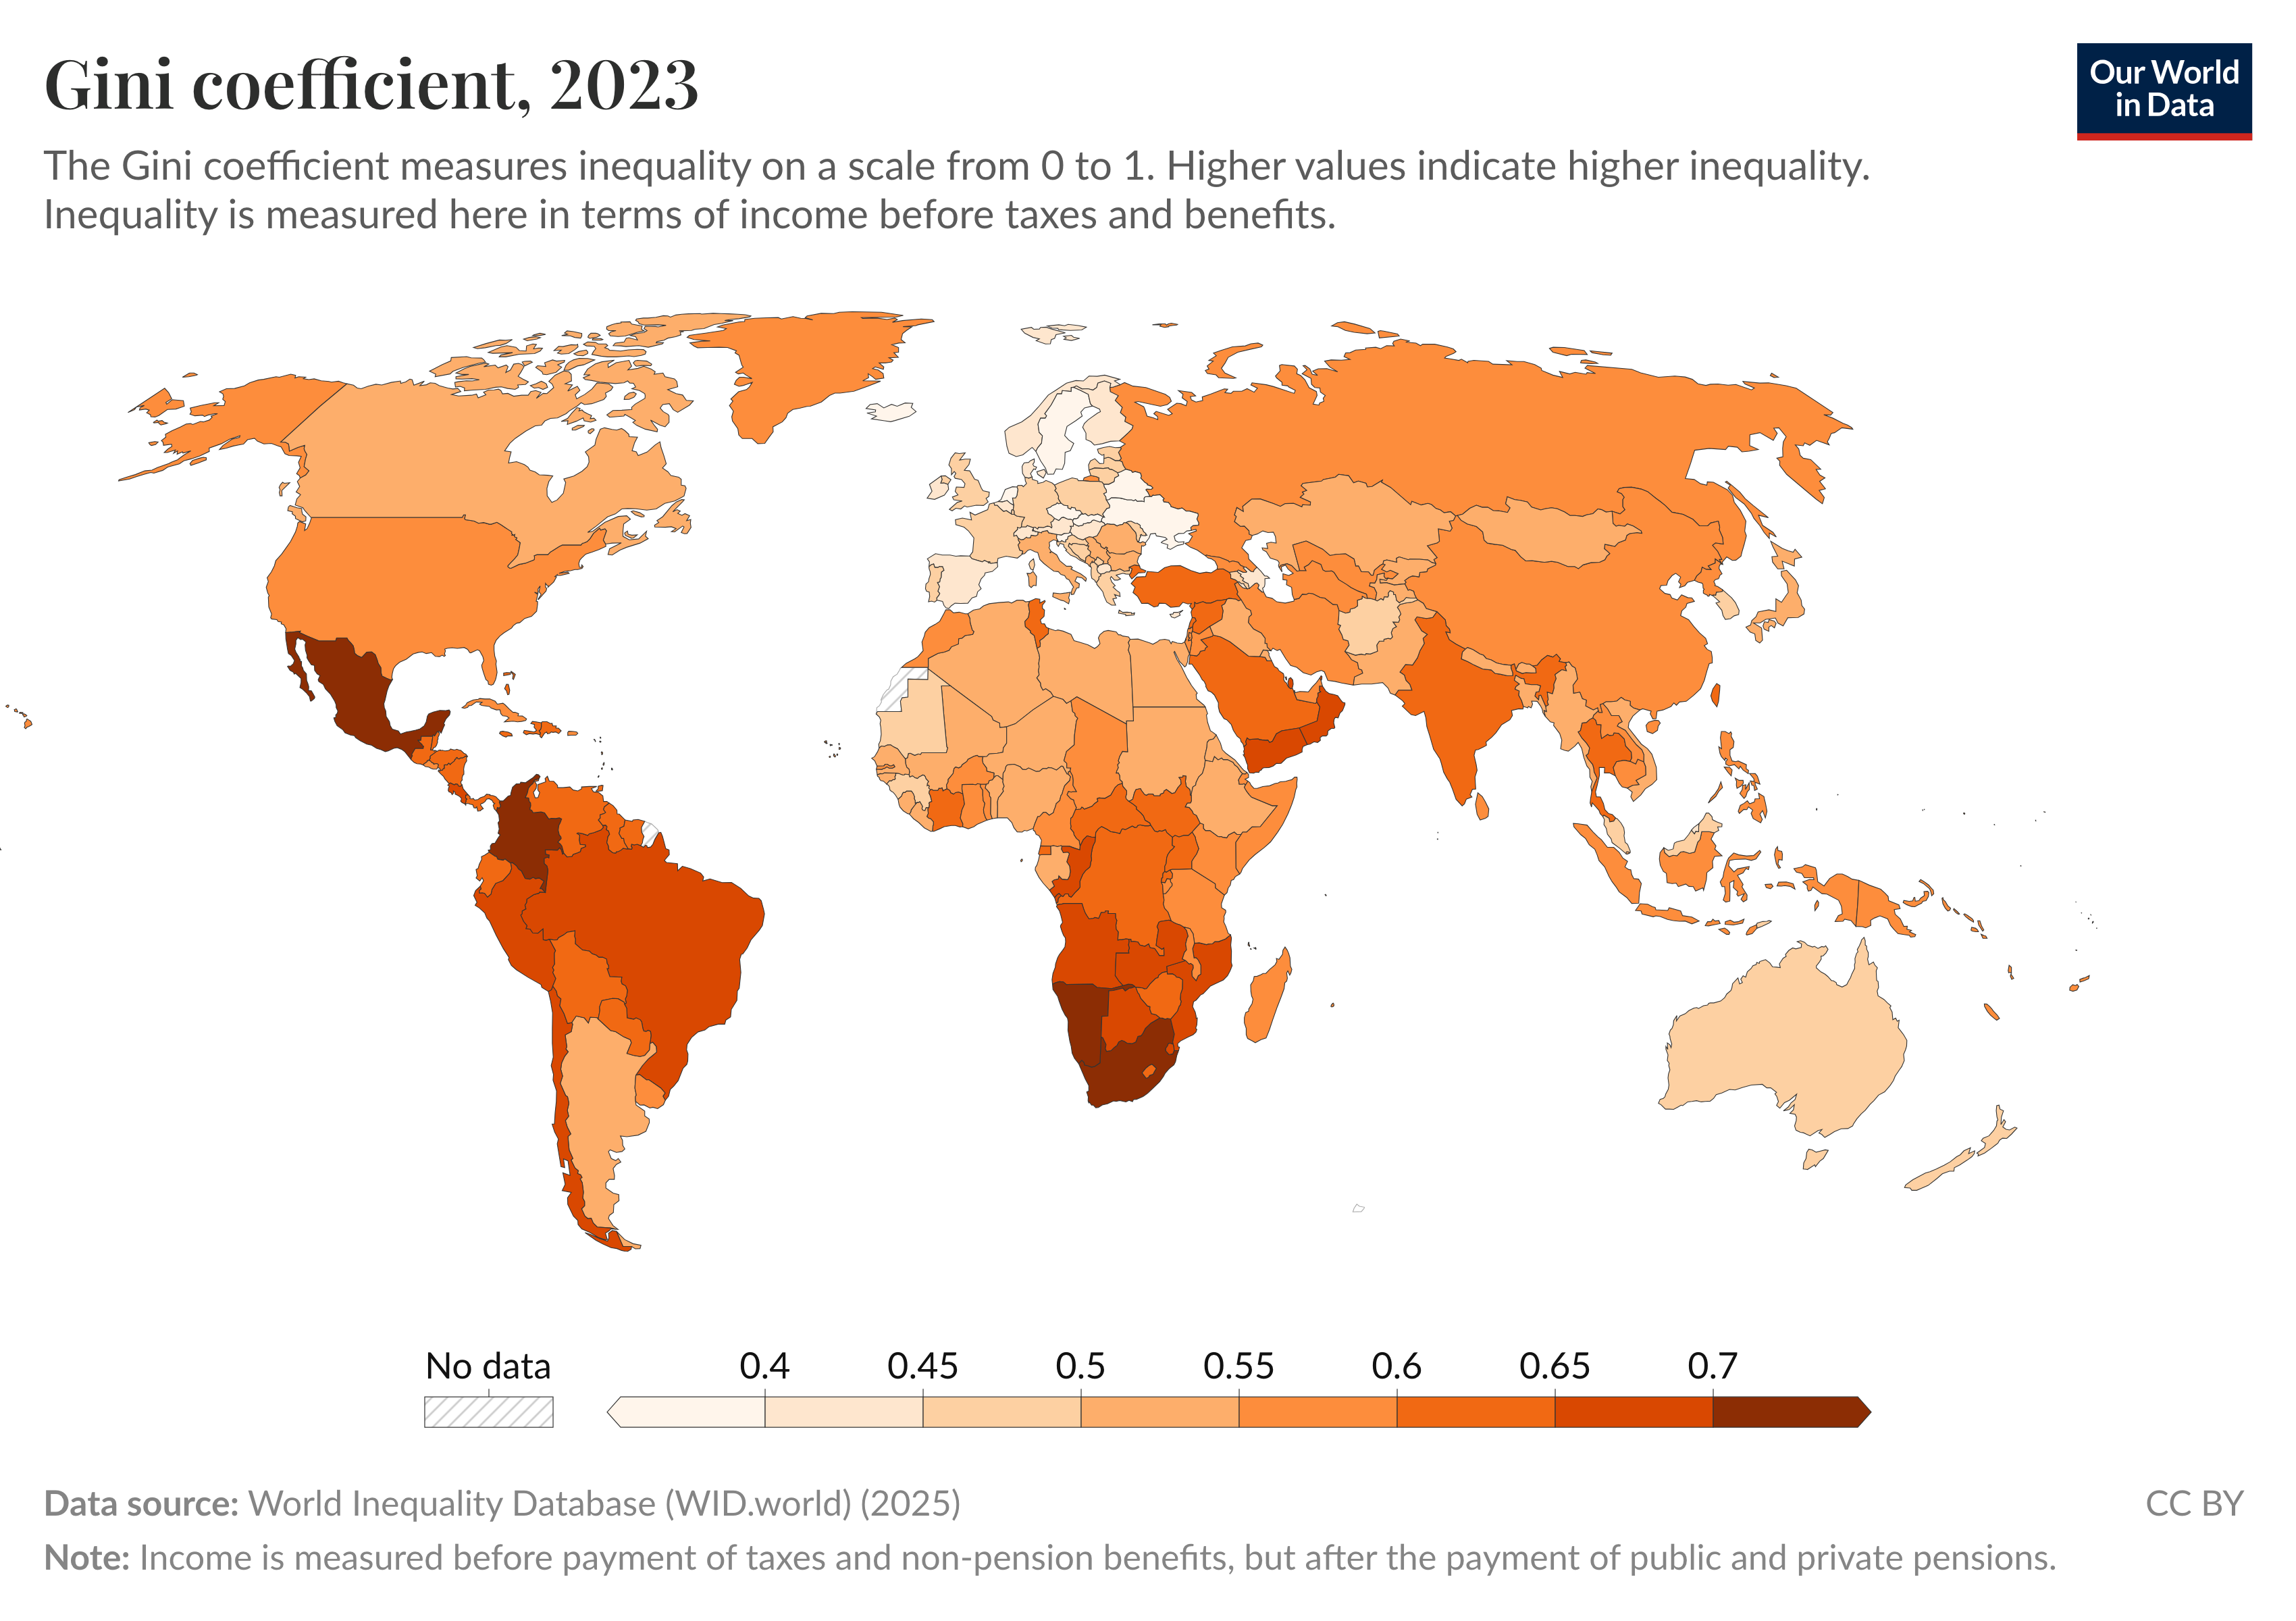
Cold Eye Earth, however, likes to check in with the top-down view, and that means taking a look at the latest Gini coefficient reading for the U.S. Is the U.S. more unequal than most of its OECD counterparts? Indeed it is. But this comes as no surprise. The U.S. has only partly been running a political economy that adheres to the “free-market welfare state” that’s more common in Europe. Yes, the U.S. has had a safety net since FDR established Social Security. But the U.S. diverges in two important ways from the OECD: Income tax burdens on higher-income earners are much lower in the U.S., and even now in the 21st century the U.S. still doesn’t offer universal healthcare. Those two factors alone—if you run them long enough—could deepen wealth and income inequality. Whereas the U.S. has a Gini coefficient of 59 (the higher the number, the worse inequality), the E.U. comes in at 48. The full data page, with the interactive version of the chart below, can be found at Our World in Data.
The outlook for the U.S. is not particularly bright, however. While the American public doesn’t like inequality much and is increasingly bitter about affordability, when given the opportunity to gravitate toward the EU model, most U.S. voters decline to vote for such changes. Meanwhile, in the background of such ongoing policy preferences, the U.S. and the rest of the OECD continues to roll through a series of technological changes that for decades have increasingly replaced workers with automation. If you believe that AI poses the risk that this automation goes into hyperdrive, then the outlook for inequality is due to worsen rapidly.
Using AI has likely become routine for most people, and this fact seems underappreciated. This “light AI” which comes in the form of advanced search, queries about daily life from finances to taxes to home repair (no doubt already helping personal productivity), is surely playing a role in the quickly rising demand that makes purveyors of AI services so excited. Cold Eye Earth uses AI semi-regularly to analyze datasets, for example. Each model has its own strengths.
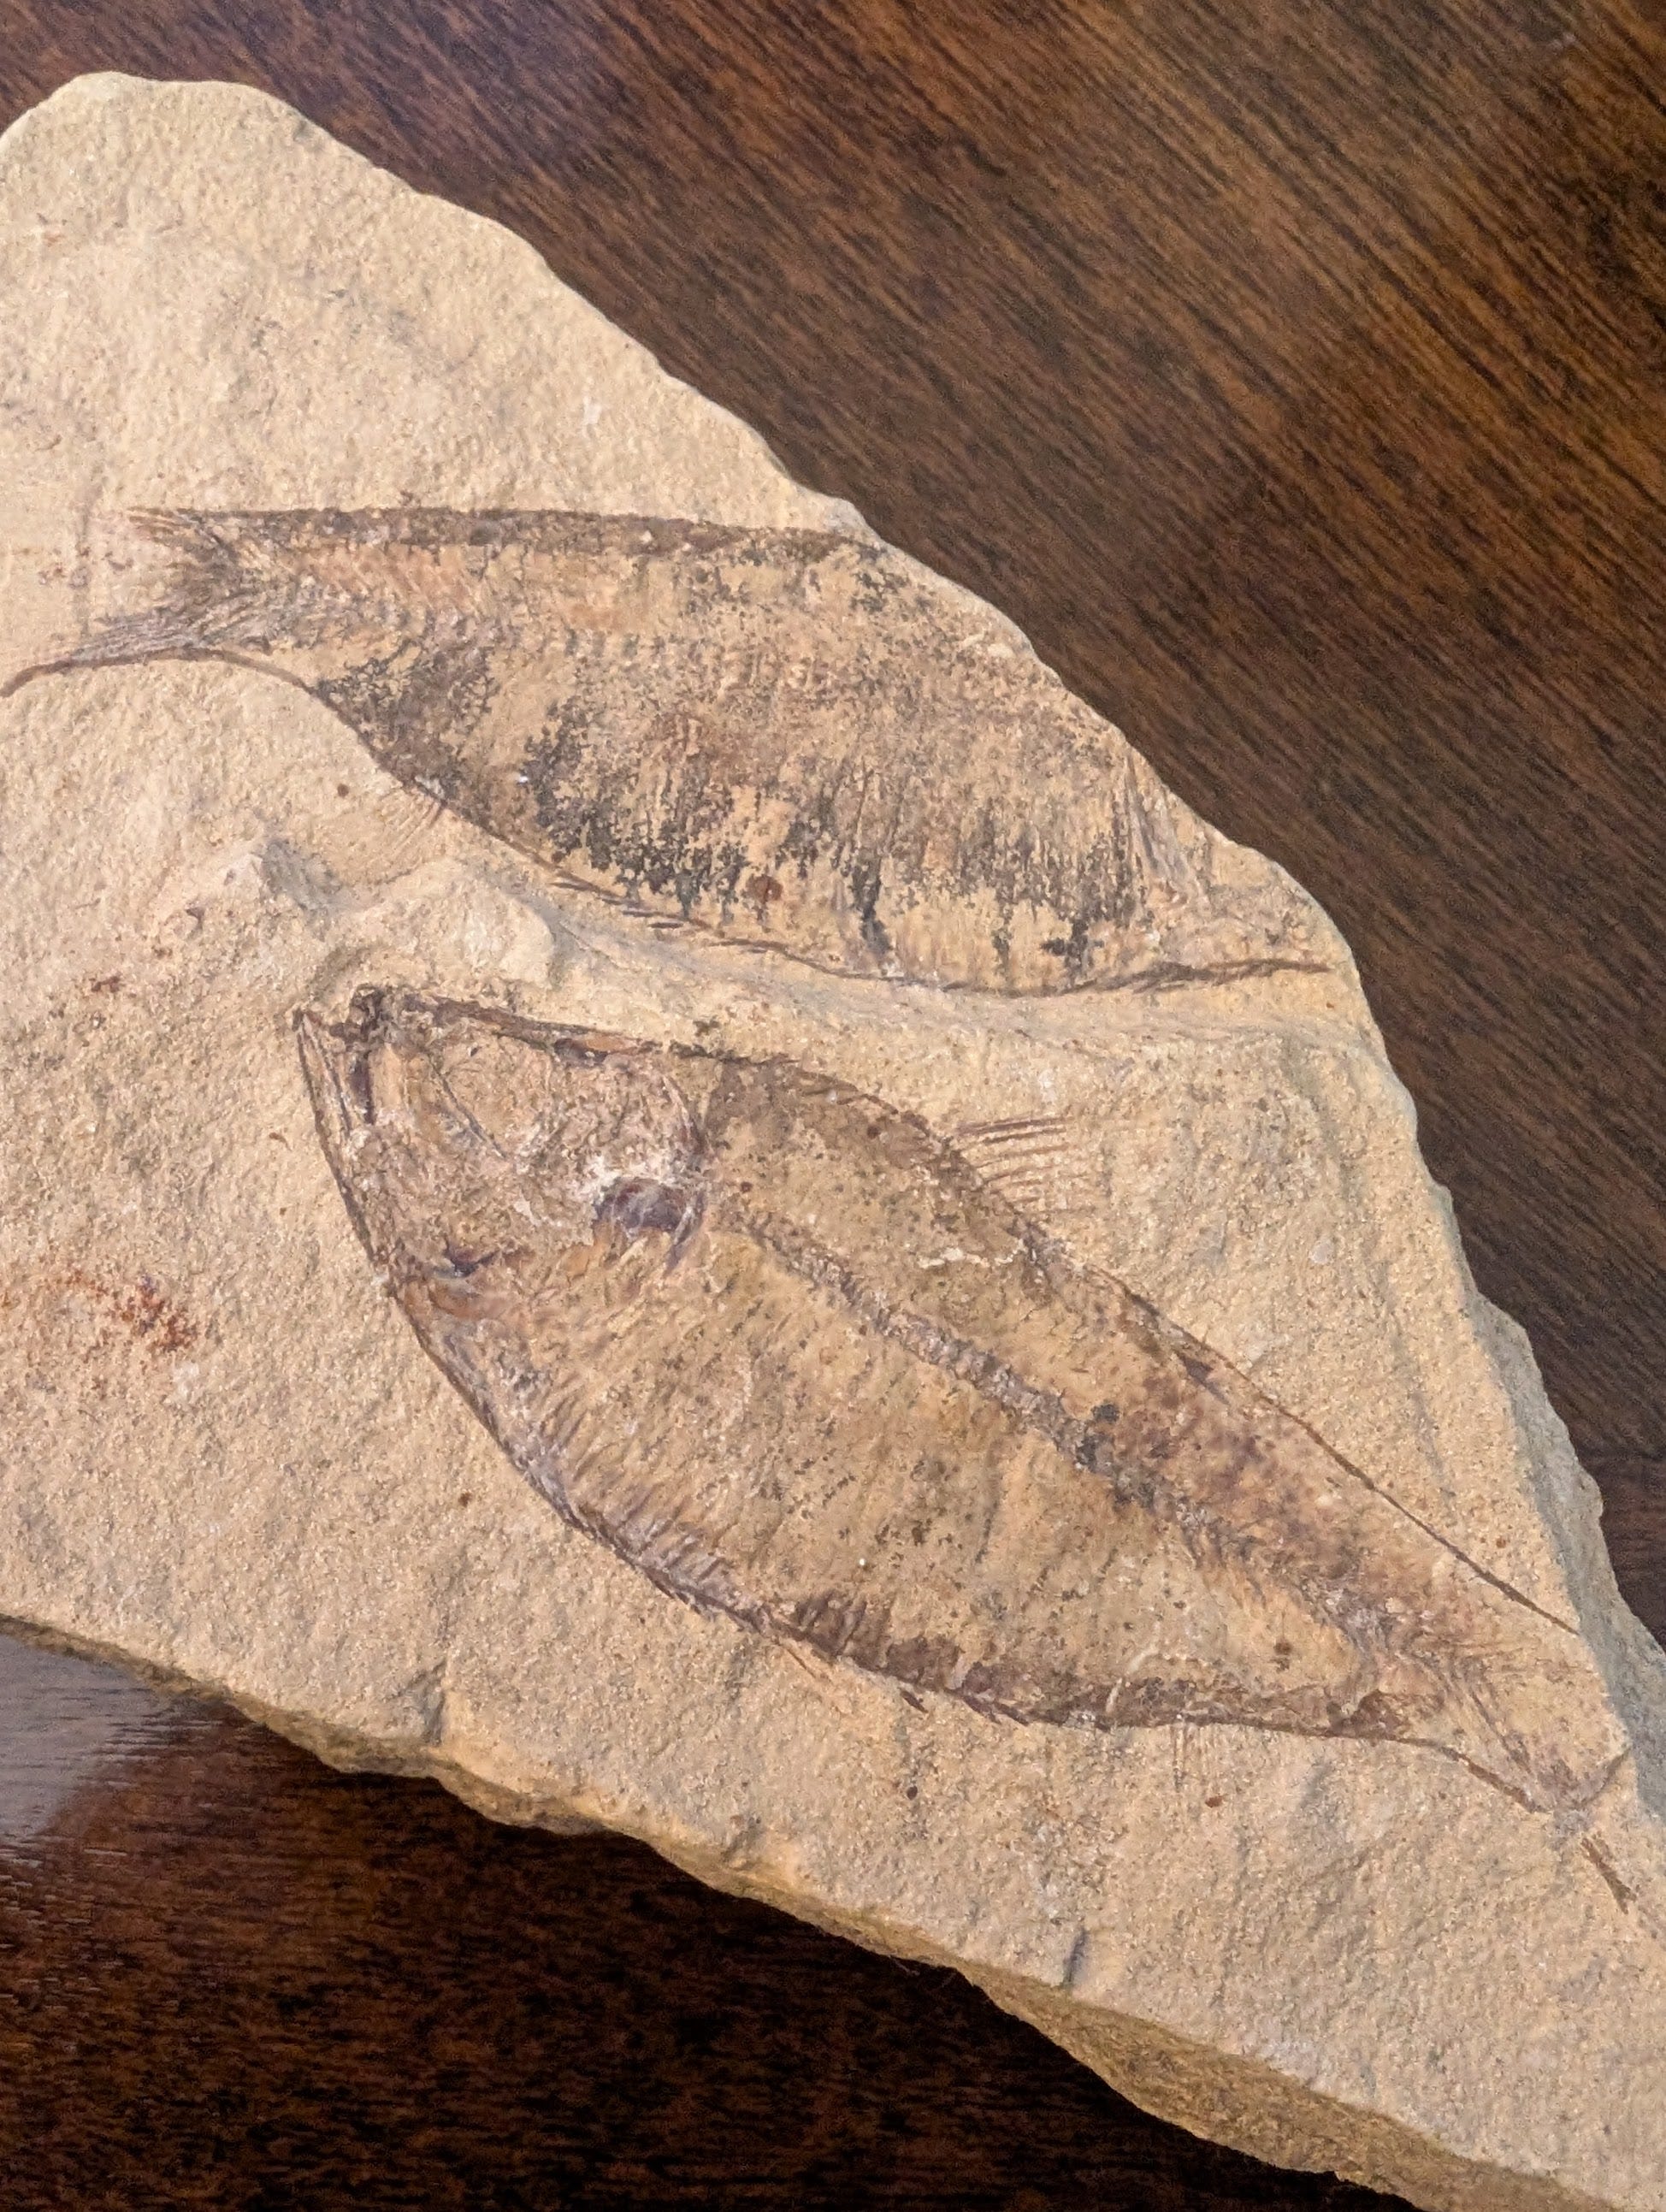
Here’s a fun one: my recent travels I was gifted this nice chunk of rock with a couple of fossils, and so I took the photo above, and asked Google’s Gemini to make its estimates. Here is what Gemini returned:
That is a beautiful piece! Based on the appearance, preservation, and the rock matrix, these fossils are almost certainly fish from the Green River Formation in Wyoming, USA.
This geologic formation is famous worldwide for producing incredibly detailed, Eocene-age (about 50 million years old) fish fossils like the ones you have.
🐟 Likely Identification
The two most common genera of fish found in this formation, and the ones that match the general body shapes in your image, are:
Lower Fish: This appears to be a good example of Knightia eocaena.
Features: It has a smaller, more streamlined, herring-like body, which are the most abundant fossils found in the formation. They rarely grow over 10 inches, and this one looks to be in that typical size range.
Upper Fish: This one might be another Knightia, or possibly a juvenile Diplomystus dentatus.
Features of Diplomystus: Diplomystus is the second most common fish and is known for having a deeper, “hatchet-shaped” body and an upturned snout (though the snout isn’t perfectly clear in the photo). They were predators that often fed on the smaller Knightia.
• News briefs • Concentration risk is growing elsewhere too, and not just in measures of inequality. Investors are quite aware that nearly all the performance in the U.S. stock market increasingly comes from a handful of mega-cap corporations, leaving small companies to tread water. • Mike Green of Simplify Asset Management thinks that the way the U.S. measures poverty has a deep flaw, and as a result we are likely undercounting poverty and underestimating the actual household income needed to support a family, in the year 2025. • New England, which has been reluctant to build gas pipelines, transmission pipelines, or enough renewables, has increasingly found itself struggling with very high winter energy prices. Now comes a plan that takes a page out of the EU’s response to the Russian gas crunch: build heat pumps, and lots of them. • Amazon will work with Energy Northwest and X-energy to build an SMR in eastern Washington, on the old Hanford site, home of the existing Columbia Generating Station. • Synchronous condensors, a technology originally developed nearly a century ago, are expanding quickly again as they solve stability challenges on grids that are increasingly composed of variable renewable energy (VRE). •
—Gregor Macdonald