
Cycles
Monday 9 December 2024


Booms and busts are reflective of human thinking, and the way in which we absorb information. That makes the rather grandiose claim offered by Blackrock this week, World economy has exited the 'boom and bust' cycle, highly unlikely to come true. The hope that humans will stop making such mistakes is not uncommon, and takes its place alongside other such theories that we have reached the end of history. We have neither reached the end of history, nor has the process of evolution sped up in such a way that would allow us to break the bonds of our own psychology. Market observers will also recognize that the arrival of such an idea—spit out from the research department at the world’s largest asset manager—happens to coincide with a notably exuberant phase of risk-taking across most asset classes.
There is no question that humans can erect institutions and guardrails that can soften economic cycles, and create systemic calm. Once upon a time, pandemics unleashed absolute chaos in societies. In the modern era, we have fiscal and monetary levers and medical technology that can convert such catastrophes into highly challenging, but manageable crises. Moreover, we have excellent information networks, and an educated workforce that can use intelligence and data to help restrain overinvestment.
But none of these inventions fundamentally alter group psychology, and the process by which an investment boom eventually broadens out and catches the public off-guard. Indeed, there’s an analogy to be made between the adoption curves of new technology, S curves, or diffusion of innovation, and the tranche by tranche acceptance of an investment boom. Interestingly, Blackrock actually cites the emergence of AI as one of the new stabilizers (“great forces,” to use their term) that will guide economies away from classic short-term fluctuations to long and extended trends.
Welp. That’s ironic, because AI can only emerge as the result of an investment boom! The billions being spent right now by large tech companies to acquire AI capabilities are making markets giddy. The scale of this capex is enormous, and is now branching out from semiconductors to include electricity production and transmission. An investment boom spreads through society sector by sector, not unlike the journey of an idea from obscurity to popularity. Will it be different this time? No, it won’t. No individual knows how much AI capability the world will need, so it’s inevitable we will eventually overinvest in capacity—chips, racks, and cloud compute.
Booms are actually good in that they perform a task for us: they are the phenomenon by which we build alot, deploy alot, and get alot done in a short period of time. Mistakes will be made. But do economies want to be entirely liberated from booms? Not likely. Perhaps a better thesis is not that the boom-bust cycle is a thing of the past, but rather, that societies still like the booms—but want to see the busts controlled. That, frankly, seems like a better description of the current trend.

Insured losses from natural catastrophes were above $100 billion in 2024 for the fifth year in a row. Another reminder that climate change is, among other things, an ongoing demand for payment. Hurricanes in the US and dramatic floods in Europe drove the bulk of the losses, according to the report from Swiss Re. Not reflected in the report: the increasing practice of cities and countries to undertake additional, extra costs when rebuilding from natural disasters, while also having to shoulder the rising cost of prevention.
US emissions from energy consumption will neither rise nor fall this year. Importantly, the US has no near term catalyst that would kick off the next round of emissions reductions. The country has mostly achieved all its emissions reductions through the retirement of coal-fired power generation over the past 15 years. But much of that capacity was replaced with new natural gas fired power, which is now cutting against emissions gains from the country’s admirable deployment of new wind, solar, and batteries. Meanwhile, the elephant in the room—emissions from the transportation sector—presses onward, also not falling or rising. Emissions from the US transportation sector in 2023 stood at 1853 million metric tonnes and, for comparison, stood at 1888 MMT in the year 2000, and 1847 MMT in 2010. In 2024, transportation sector emissions are on course to reach…wait for it…1862 MMT. Are you getting the message yet?
Cold Eye Earth has been warning about this outcome for two years now: the collective set of climate policies chosen by the US means it has functionally pushed emissions reductions far out in time. It’s a country that achieved an early and easy windfall of emissions reductions through an attack on its ancient coal fleet, replacing that capacity with a combo of natural gas, wind, and solar. And this has understandably led to a broad and incorrect sense that the same volume of reductions can be secured once again. This, in a country that has done next to nothing about its greatest emissions problem: transportation! In that sector, the US has a relaxed, gently moving EV adoption policy that, given enough time, will work—eventually. How much time have you got, though?
Notice how power sector emissions are now starting to join transportation emissions in the flatline. The great decline in power sector emissions, starting in 2008 and running into 2020, is not about to be duplicated despite the buildout of wind, solar, and storage.
And why is the decline in power sector emissions not about to be duplicated again? Because to do so the US would need to start closing economically viable natural gas plants. To give you a big picture view, here is the EIA on the long-term history.
The mix of energy sources for U.S. electricity generation in the United States has changed over time, especially in recent years. Natural gas and renewable energy sources account for an increasing share of U.S. electricity generation, and coal-fired electricity generation has declined. In 1990, coal-fired power plants accounted for about 42% of total U.S. utility-scale electricity-generation capacity and about 52% of total electricity generation. By the end of 2023, coal's share of electricity-generation capacity was 15% and coal accounted for about 16% of total utility-scale electricity generation. The share of natural gas-fired electricity-generation capacity increased from 17% in 1990 to 43% in 2023, and its share of electricity generation more than tripled from 12% in 1990 to 43% in 2023.
It is surprising how many observers are still under the assumption that building wind, solar and batteries will cut into the fossil fuel underlayer in the US anytime soon. That fossil fuel underlayer is increasingly robust, and importantly, young. Indeed, the US is building new wind and solar right up to the point where it would cut into the fossil fuel underlayer, and then stopping. Why? Economics. Wind and solar are covering marginal growth in US power which is great news, but this pattern has obtained for five years now.
The chart below says it all. When we first started building out big wind and solar, in the early part of the last decade, coal retreated so quickly and greatly that wind+solar not only covered marginal growth but was able to depress sources ex-wind and solar from 2010 to 2020. The success of this period was due, in part, to the fact that total system demand wasn’t growing. In the past five years, however, sources ex wind+solar have held strong. Again, Cold Eye Earth wonders: where were all the analysts when the great leap forward in natural gas capacity expansion started to roll? An answer: they were so giddy about the coal crash it did not occur to them that a new path dependency was forming in natural gas.
The sum of all these trajectories is that total US emissions are flatlining this year. Cold Eye Earth takes a view that really should not be controversial: the easy emissions reductions were taken first. The harder reductions now lie before us. They are hard, because to do something substantive over the next ten years will require that someone’s valuable assets be destroyed. Good luck with that.

Emissions reductions can be thought of as the profits that accrue from the business success of clean energy growth, and the closure of fossil fuel energy. This analogy may be helpful in understanding how these “profits” can trend higher, trend lower, or fluctuate. Most new businesses feast on the profit margins of legacy, incumbent businesses and if they are successful in doing so consistently, eventually those legacy businesses are replaced. Emphasis on eventually. Jeff Bezos is often quoted for saying “your margin is my opportunity.” Amazon’s pursuit of that opportunity has turned global retailing upside down the past twenty years, reordering the world from stores to warehouses, with a delivery truck to bridge the distance. It appears that many people in the climate community have been expecting or hoping that this margin-stealing campaign will roll onward uninterrupted in similar fashion.
But the business of earning “profits” from emissions reductions is likely to have cycles. New energy technology has just experienced a very fruitful period of strong “profit” growth as it feasted on the weak carcass of antiquated, uneconomic coal power in the US. But from here, the “profit” outlook for clean energy (again, “profit” is being deployed here as an analogy for emissions reductions) is far less certain. Here, it might be helpful to get very direct, very literal about this problem.
In 2015 and 2016, two new gas-fired power plants became operational in New Jersey: the Newark Energy Center and the Woodbridge Energy Center with a combined nameplate capacity of 1428 MW. Apart from the challenges for wind and solar embedded in the topography of the northeast corridor, where is the “profit” opportunity for clean energy with respect to these two plants? Remember, the US got huge and fast gains from closing old coal plants that became operational as early as the WW2 era, and we shuttered alot of the old natural gas capacity too. So, while there’s opportunity here, it’s a very different kind—one that’s in a distant future, not now. And when you add up the gargantuan array of new natgas fired power capacity, and its youthful age—mostly built since 2010—it starts to get easier to accept that “profits from lower emissions” can be cyclical, and can even run into a “profits” recession.

Legacy assets are incredibly tough to disrupt when their running costs are low in comparison to the large capital expenditures required to build new. A good example of a policy effort to bring down expenditure costs for newbuild is the longstanding federal EV credit. The credit has in no way triggered an EV adoption craze, but without it US EV adoption would not be close at all to our current position. What this means is that for many people, their legacy ICE car still represent economically affordable value, and to extract that value many ICE owners will keep running their cars for years to come.
It wasn’t always this hard to turnover a fleet. In the second half of the 20th century, the majority of cars had far shorter lifespans. At one point hitting an average age of 5.7 years and rarely getting beyond 100,000 miles. Ouch. Well we solved that problem. The new problem: cars last longer. Alot longer. In 2024, the lifespan of US vehicles reached a new all time average high of 12.6 years, with many models easily making it up to 200,000 miles. Toyota distinguished itself starting in the 1980’s for the amazing durability of their cars and trucks, and generally speaking the auto industry has become so much better at building lasting models.
Wind and solar will impress you greatly with their 2024 global growth performance. In 2023, the two technologies together grew generation by 537 TWh, advancing from 3430 TWh to 3967 TWh. According to the simple growth model maintained by Cold Eye Earth, generation will grow 655 TWh this year, from 3967 to 4622 TWh. You can see that projection in the chart below.
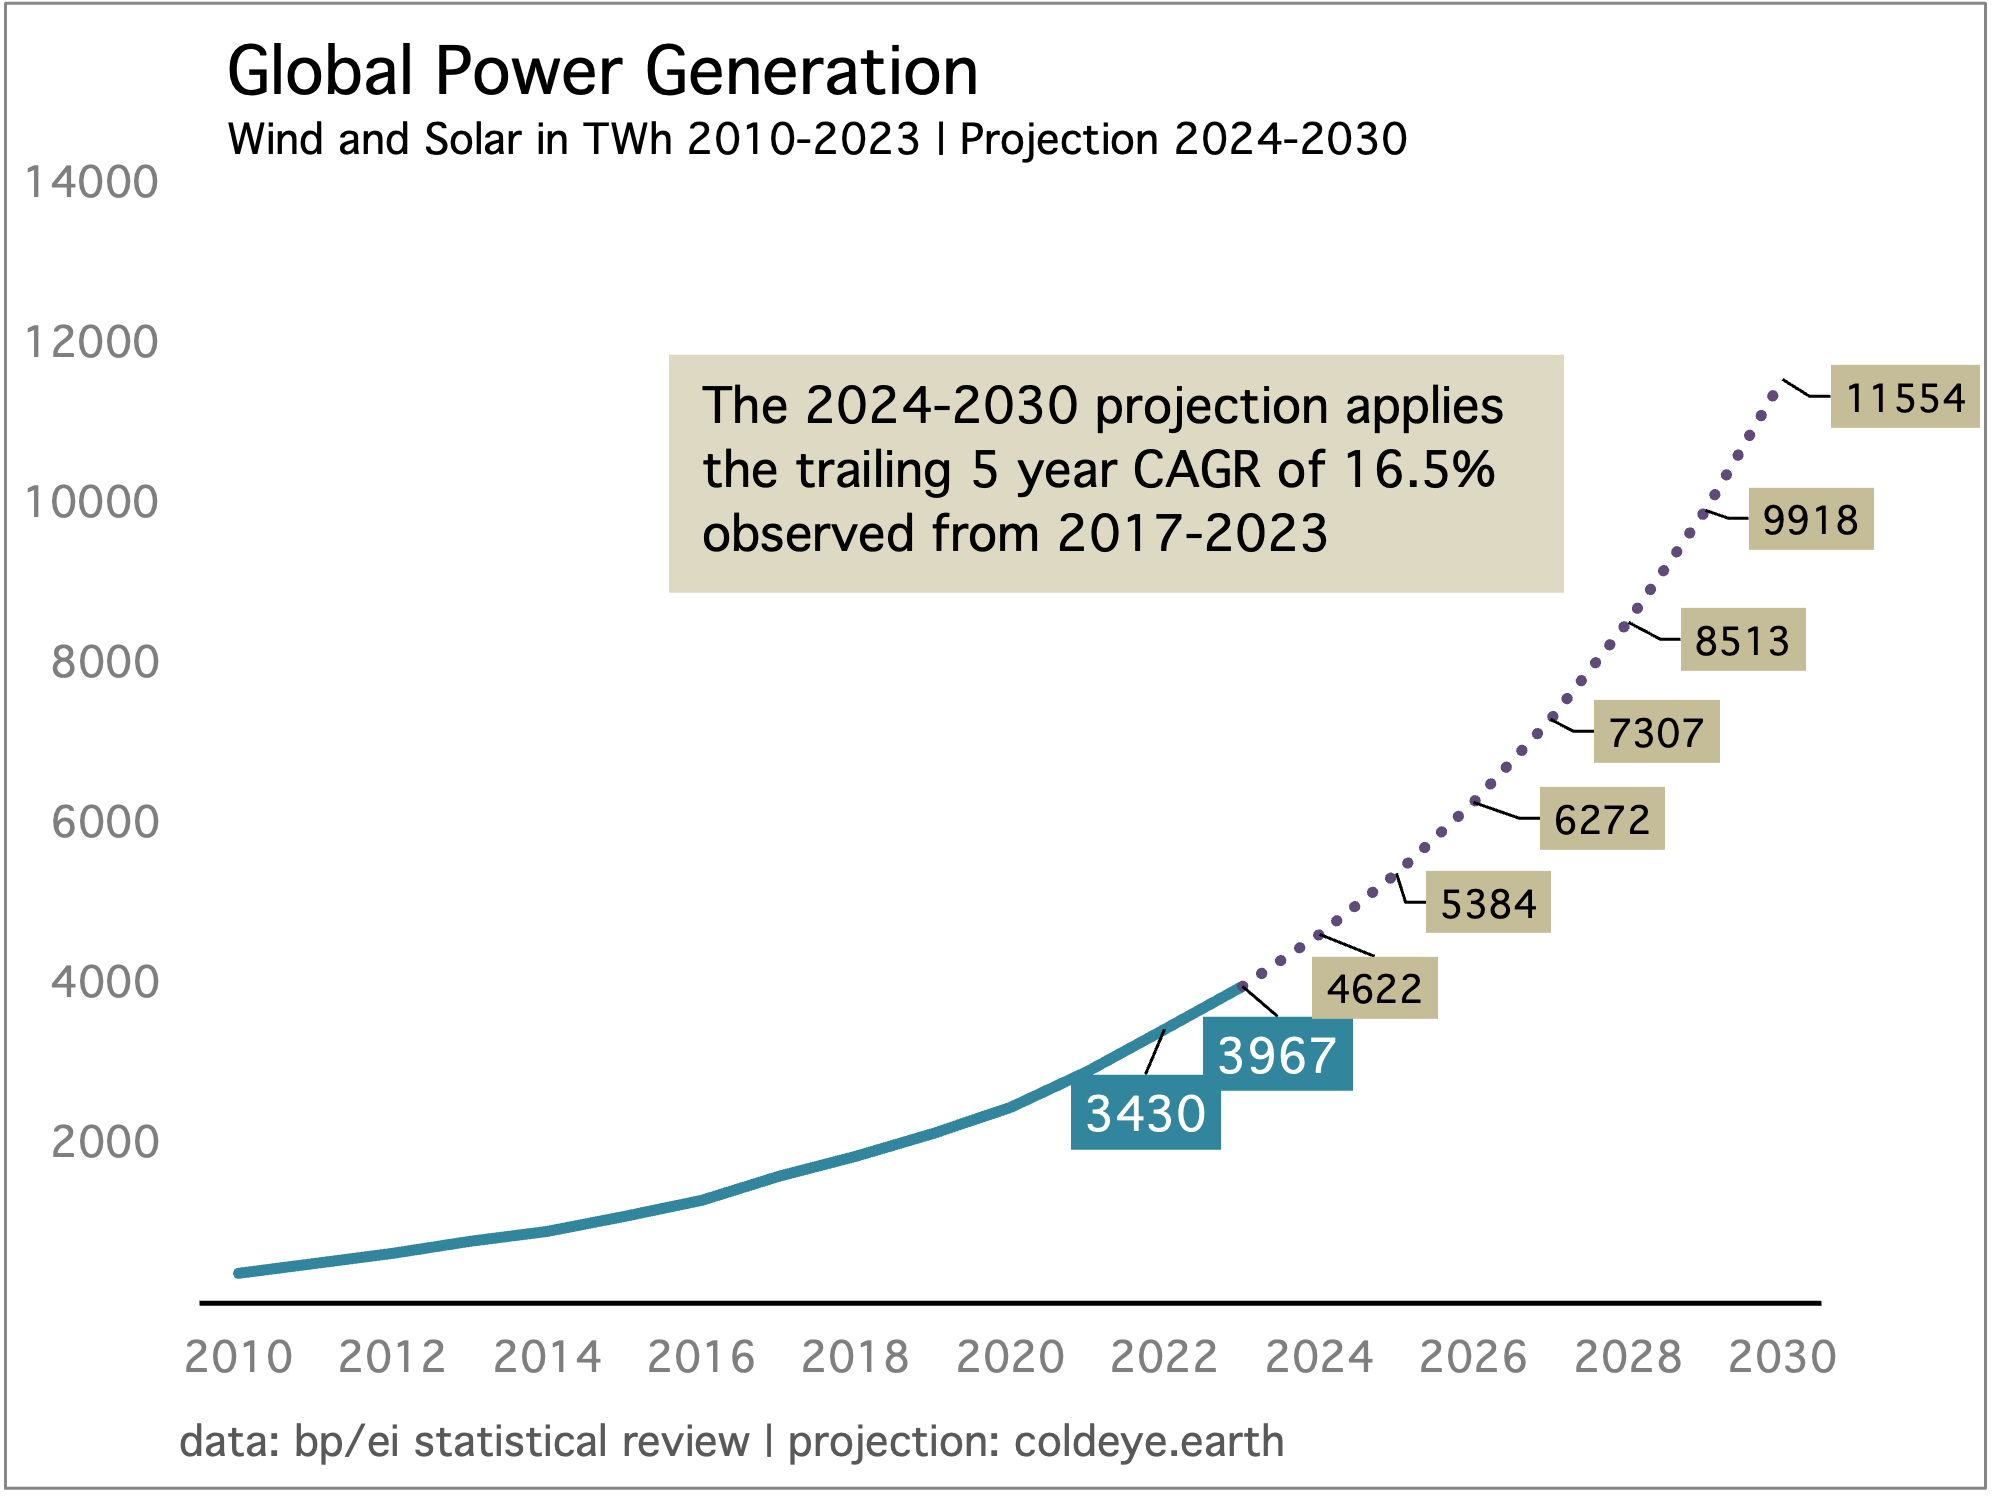
However, it’s now clear that combined wind and solar generation will exceed the model’s growth this year. Cold Eye Earth estimates that generation will grow as much as 800 TWh, given that solar installations may reach as high as 600 GW in capacity terms. This is explosively good news. However, if we take the IEA’s estimate of 4% total growth in global power generation this year, those 800 TWh of new, clean power from wind and solar will stand before about 1200 TWh of total system growth.
For yet another year, the fossil fuel underlayer is safe, in global power.
—Gregor Macdonald