


A deceleration in the rate of global demand growth has greatly disturbed the oil market, causing West Texas intermediate (WTI) to fall from the mid $80’s to the mid $60’s in just eight weeks. While price sensitivity to supply/demand shifts is common to all commodity markets, it’s worth recalling two ongoing realities that sit firmly in the background here, making oil especially vulnerable. The first is that we’ve fully entered a new era of slow demand growth, one that began about ten years ago. In the old era, every new unit of global GDP required new units of oil demand, such that the growth rate of one was joined at the hip with the other. In the new era, annual global oil demand growth tends towards a weak, plodding 1.00% rate. Indeed, this is one reason why the “supply-crunch-from-underinvestment” thesis can never get any traction: it’s effortless for the global oil industry to increase supply by a single percentage point each year. Yes, the industry has been underinvesting for a decade. And that’s been the correct decision, despite the clarion calls from the oil bulls.
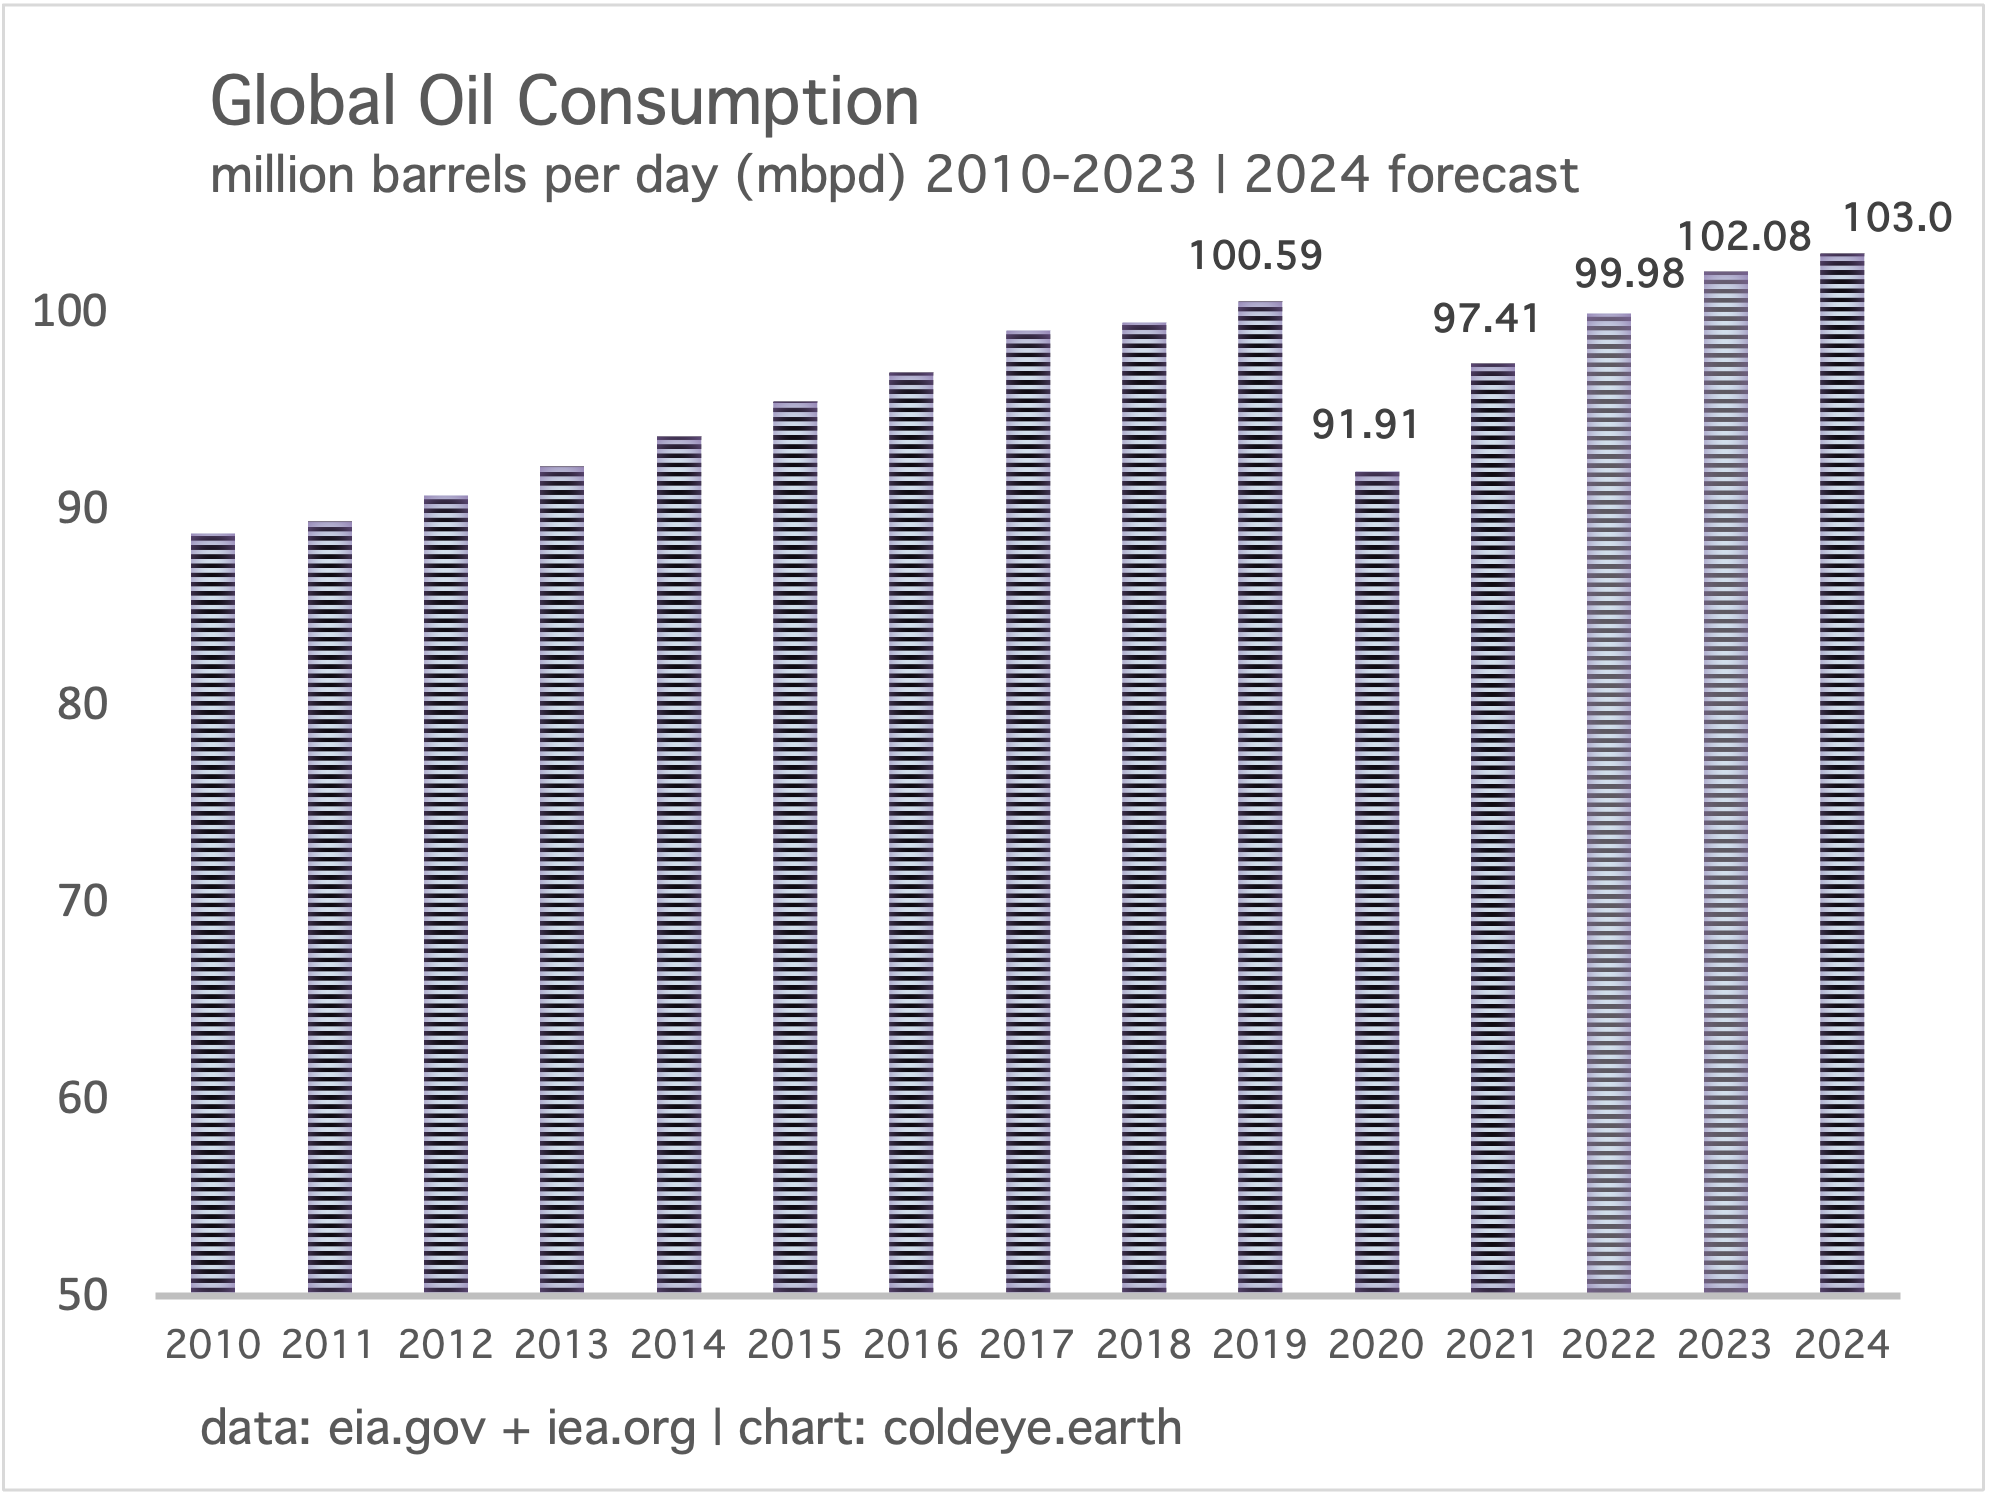
This chart from the IEA, which accompanied their recent Oil Market Report, tells the tale. Outside of recovery periods, when demand rises at above average rates, the ongoing trend is slow. As the IEA points out, not only has China’s demand pulled back, but the main event is that we have lapsed back into weak annual growth.

The second ongoing reality that governs oil’s fortunes from the background is the rather full level of OPEC spare capacity that’s been hovering over the market for years. Of late, there’s a group of young gun oil traders who’ve become fond of criticizing this metric as a kind of fake news. In their view, OPEC couldn’t produce much more if they wanted to. Ha ha. It’s telling that this thesis has never come true, and the only time the world suffered much upward pressure on oil prices recently occurred during the Russian attack on Ukraine, and the attendant supply chain problems that showed up in the global oil market from sanctions. Supply was indeed the issue. But not OPEC supply!
The pattern in OPEC spare capacity is dead simple to understand. In 2020, OPEC spare capacity 1. built up during the pandemic. 2. started to fall after the pandemic, as the global economy recovered. 3. is now building again as the rate of demand growth slides back into its new pattern of weakness. The chart comes from the EIA’s Short Term Energy Outlook, for September 2024.
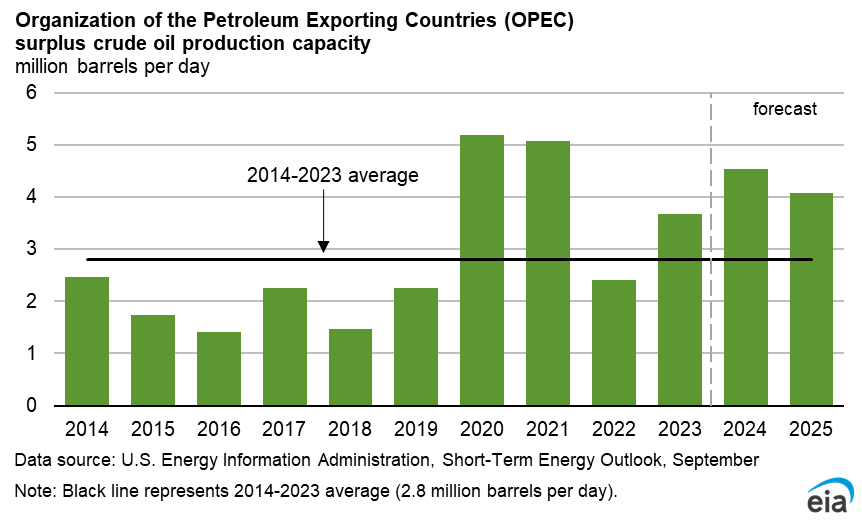
From where does the build in OPEC spare capacity emanate? From its largest producer of course, Saudi Arabia. When Saudi dials back production, spare capacity (by definition) rises. Addendum: while it’s true that the US now outproduces Saudi Arabia, it’s not the horserace most assume. Saudi production is down—by choice.
You are reading a free issue of the Cold Eye Earth newsletter, which covers the progress of energy transition, and its economic implications. There are very few free issues each year, so please consider subscribing at the highly reasonable rate of $8.00 per month. Cheers!
The inflation adjusted price of oil is currently dirt cheap, and roughly matches price levels first seen twenty years ago, in the Autumn of 2004. The EIA maintains a chart of inflation adjusted oil prices, and here is how that works. You begin in the present, in this case September 2024, which is your baseline. At this starting point, the nominal price of oil and the inflation adjusted price of oil are the same, around $73.25. As you move back in time, however, the two prices diverge. For example, do you remember $125.00 oil (brown line) in the summer of 2008? That oil would actually cost $183.00 using today’s money (blue line) because today’s money buys less of (mostly) everything from twenty years ago. The $73.25 (real) price presently in 2024 was first seen in the Autumn of 2004. But of course, that wasn’t the nominal price back then. No, the price then (also considered outrageously high) was about $45.00. The spread between those two prices gives you an idea of inflation’s impact over two decades.
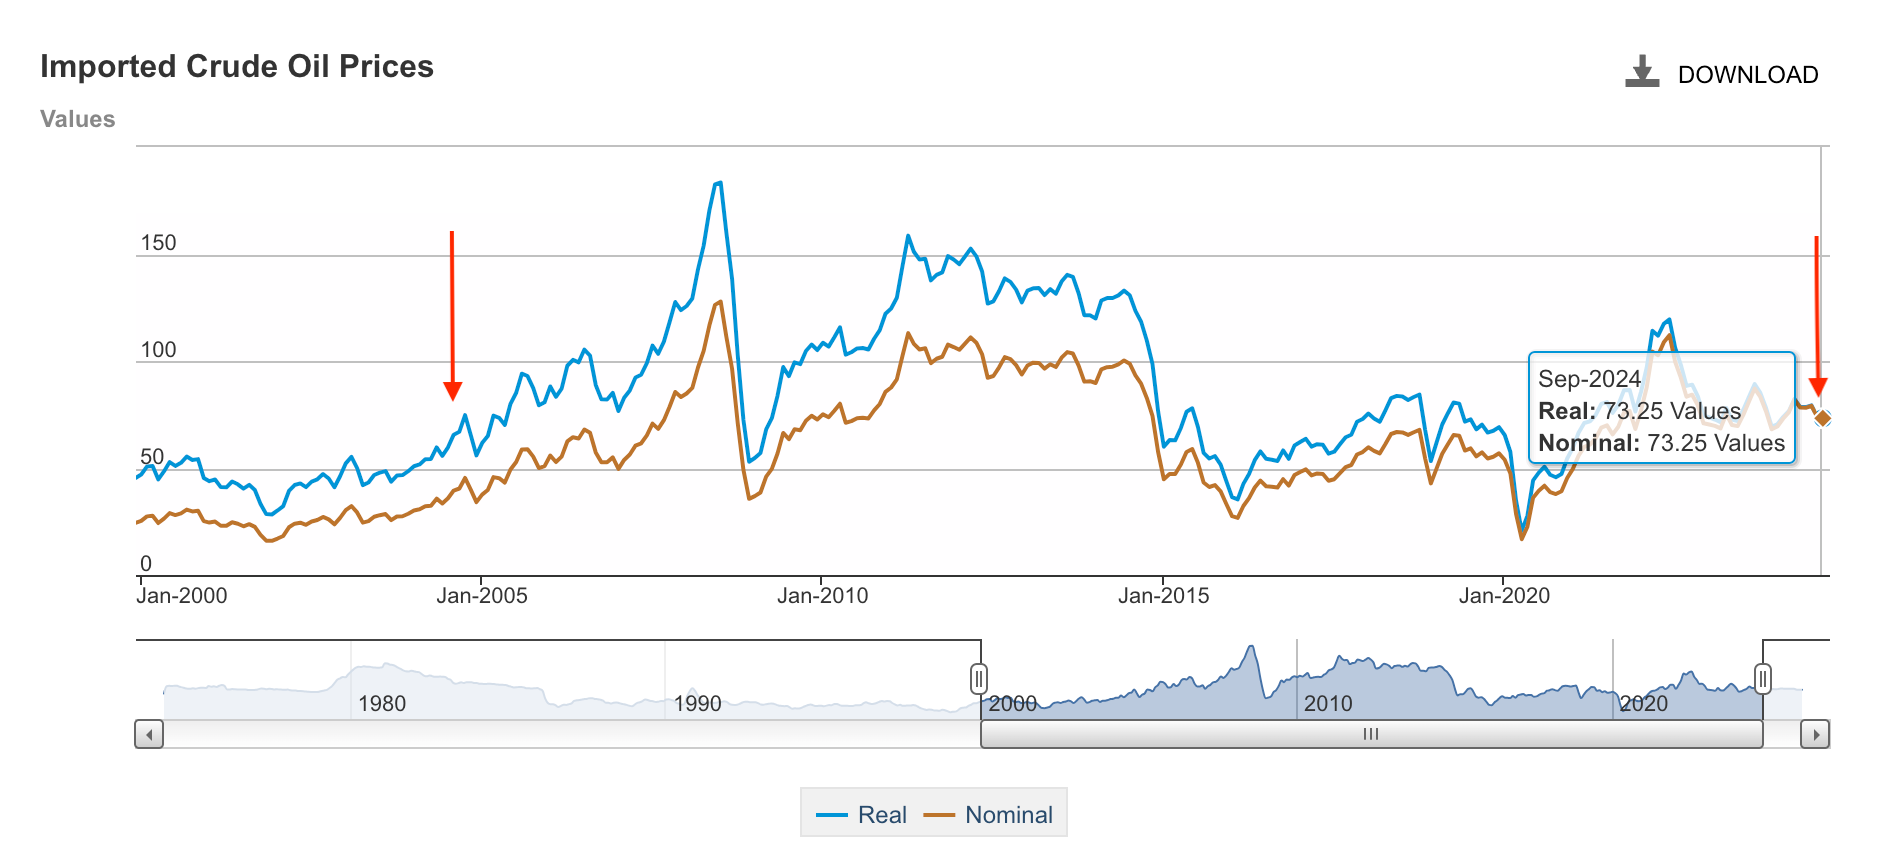
It’s long been said that keeping a portion of one’s portfolio exposed to commodities can be a good way to keep up with inflation. But oil has entirely failed in this regard, having fallen behind most asset classes like stocks, real estate, precious metals, art, and collectibles. This is particularly brutal for oil producers in the West, who’ve surely seen the cost of labor, equipment, fees, taxes, and financing costs rise—while the price of the commodity they sell has gone nowhere in twenty years. Imagine if the best price a manufacturer could ask today for furniture, cars, building materials was about the same as two decades ago?
Let’s bring this to a conclusion by illustrating what the past two decades have been like for an American oil producer: Occidental Petroleum. OXY is an exceptionally well managed company, and happens to be a favorite of Warren Buffet who has been investing in the company of late on a continual basis. So far, that plan is not working out, to say the least. As you can see, OXY’s share price is back to levels seen 18 years ago, in 2006. If your house was back to price levels from 18 years ago, your town or city would have clearly suffered from an ongoing calamity. That’s how we should think of the oil business: who in their right mind would want to get involved with it?

Vice-Presidential candidate J.D. Vance said this week on CNBC that despite the US position as the number one global oil producer, we should be actually producing even more. Senator Vance said nothing, however, about what effect an overproduction policy would do to oil prices. But any college freshman would be able to answer that question. In Vance’s telling, the trajectory of increased production under the Trump administration during 2017-2021 would lead one to conclude the US should be producing, by now, an additional 3 million barrels a day. Small problem: the global market has no need for an additional 3 million barrels a day, or even a million extra barrels a day. Worse, the breakeven price for oil production has risen (see the previous discussion of inflation in costs to the oil industry), putting greater pressure on profitability. A plan to overproduce would of course send the global price of oil careening, removing profitability tranche by tranche from the highest cost producers down to the lowest cost producers. Needless to say, only the Middle Eastern countries could still make money if oil was back in the 40’s or 30’s.

This also points to an unexamined myth that seems to affect Americans more than others: your domestic oil industry, understandably, has no plan or goal to deliver you cheap petrol prices. US producers would go bankrupt if they offered oil at prices that would bring back $1.00 - $2.00 gasoline.
The deceleration in global oil demand will no doubt be misunderstood as “good news for climate” or worse, “the beginning of oil’s decline.” Neither of these conclusions can be extracted from current information. Rather, we are still very much in a different regime—the period which will see oil demand plateau, but with oscillations. Cold Eye Earth has been resolute on this point for several years: short-term demand declines are not the start of a new trend, and advances aren’t either. Humans have a real hunger for clarity and trends are a particularly favorite concept that helps with building up a story. But the only story here is that the world has done enough to finally slow oil demand growth to a crawl—but not so much that global oil demand is about to decline.
The IEA started the year with a forecast that global demand would rise by 1.1 mbpd in 2024. That has now been dialed back to a forecast of 0.9 mbpd. Not a big revision, but, if the rapid deceleration in China demand continues, we can expect to finish the year even lower. Also worth noting: the IEA “house effect” often leads them to overestimate Q4 demand, and if that happens again this year, we could see that 0.9 mbpd estimate shrink further, by another 0.1 to 0.2 mbpd. The multi-year forecast here at Cold Eye Earth has been that 2019 likely marked the beginning of an oscillating plateau that would carry on for years, with fluctuations both up and down of 1.00% - 1.50% around that level. How has this forecast fared? OK so far, but 2024 even at its weaker growth pace will, when all the data is finally revised for the year, turn out to exceed the 1.5% oscillation by at least a half percentage point. That’s outside the forecast, but, it would have to be followed up by more oil demand growth in 2025 to really break the plateau, and we are too far away in time just yet to know how that will turn out. The takeaway, however, is that contra all the voices who keep yapping about peak global emissions about to convert to a decline! are still wrong. Equally, oil bros really do not seem to have gotten the memo that 20th century oil demand growth rates are long, long gone, and we are barely registering 1.00% growth now. I’ll add a zinger to wrap up this section: it’s highly unlikely Warren Buffett has correctly analyzed the situation because when you add a new regime of slow growth to OPEC spare capacity, and the cost of production well exceeding the market price of the product, investing in oil companies seems like a really bad bet—and it has been a bad bet for a decade.
The US is on course to export 10% more energy this year than it consumes. Longtime readers are familiar with this chart as we’ve been tracking it for a decade or more. New readers might appreciate a brief explanation. The US produces energy of nearly every type from oil to solar power. And the US consumes some portion of every energy type it produces. The US still imports some energy, almost exclusively petroleum, but turns much of it around for export again after running it through our refining complex. Finally, the US also exports a fair amount of other energy, like coal and natural gas in LNG form. When you add it all up and net it all out, you get a kind of energy balance sheet—not measured in units of dollars, but measured as a standard unit of energy.

The Obama administration greenlighted the first LNG facilities in the Lower 48 in 2014, and the buildout of new LNG capacity has soared ever since. Roughly, the US in the new era of LNG exports has exported an amount equal to 10% of its own production, consuming all the rest domestically. Foreign demand for LNG, and domestic demand for natural gas, have both grown steadily for some time. Now, according to the EIA, total North American LNG export capacity is set to double over the next four years, with new capacity in Canada, Mexico, but mainly in the US.

A helpful tip to readers: a measure that includes both Canada and Mexico LNG capacity is not merely an adjacent viewpoint but a central one. There is major connectivity by pipeline that transports natural gas between the three countries, and to Mexico especially. It’s also worth considering that when LNG export capacity first appeared in the Lower 48, this immediately transformed the pricing of natural gas not just in the US, but across all three nations because US LNG effectively broke not just US natural gas but Canada and Mexico gas out of landlock.
Cold Eye Earth has warned for years that the economically recoverable reserves of natural gas in North America are gargantuan. That’s precisely the reason we’ve not been hurt at all by price even as demand has grown, because there is simply too much of the stuff. Indeed, at $2.25 for a million BTU of natural gas presently, the price might as well be close to free on an inflation adjusted basis. That is a shockingly low price that you could have encountered twenty-five years ago.
A bottle of Coca-Cola has kept pace with inflation better than a million BTU of natural gas.

A certain class of investors are quite frustrated that commodities are doing so poorly against other assets, like equities. But that is the nature of resource investing. The supply deficit periods, when the world takes years to finally lift output to meet demand, are heady and can generate enormous profits. The supply surplus periods are something different altogether, but can also take years to work off. Right now the world oozes with plentiful natural gas, oil, and coal. Cold Eye Earth does not have good news for these investors. First, the project of energy transition, while often slow, and quiet, has been plugging away now for long enough that it really is affecting the price of fossil fuels. Second, technology both in everything from heavy industry to software keeps advancing. Even if one cuts an AI forecast in half, that still provides plenty of room for notable productivity gains in the years ahead—and yes, AI will be applied to the energy sector (and already is) in everything from weather forecasting to equipment manufacturing. Indeed, a very big picture idea is appropriate here: humans are resource exploiters, but humans are also resource maximizers. Our whole game is to do more with less. You can think of the maximization game, really, as a function of nature: we transform our condition by utilizing resources but we always soon turn to using less resources to produce the same, or even more, of our output. This is the most fundamental definition of profit. Profiting from nature is what we do. And this does not bode well for fossil fuels, and certainly not for fossil fuel investing.
—Gregor Macdonald