
Large Thing
Monday 12 May 2025


For about a half century now oil has been steadily losing market share to an array of other energy sources, in the global economy. There are myriad trendlines which help explain this evolution, but the rise of electricity as an economic development tool is certainly the most influential, followed by economic development more generally, which tends to drive out excesses and inefficiencies. Regardless of where you stand however on these issues, everyone agrees that the oil sensitivity of the global economy has fallen dramatically. That’s the result of oil’s market share falling from 50% to 30% over this period.

The reality however is that while oil’s market share has fallen, it’s consumption in absolute terms has continued to rise, and is once again reaching all time highs. This is exactly the juncture where portions of the global climate community finds themselves ensnared, with too much focus on the prospective terminal growth phase of an energy source like oil, while paying insufficient attention to the relentless growth in aggregate energy use. Yes, each unit of global GDP relies less now on oil. Instead, reliance on coal (new all time highs), natural gas (new all time highs), and renewables (also new all time highs) has risen. So, during the 50 year period when oil’s market share fell from roughly 50% in 1973 to 30% recently, oil consumption itself advanced by 67%, from 56 mbpd (million barrels per day) to over 100 mbpd.
Is there any indication that oil has reached its terminal growth phase? Let’s consider a few, important points of interest in this regard. First, global oil demand is up only 2.2% since the year 2019—an important baseline year, as oil demand reached a new all time high of 100 mbpd prior to the pandemic.

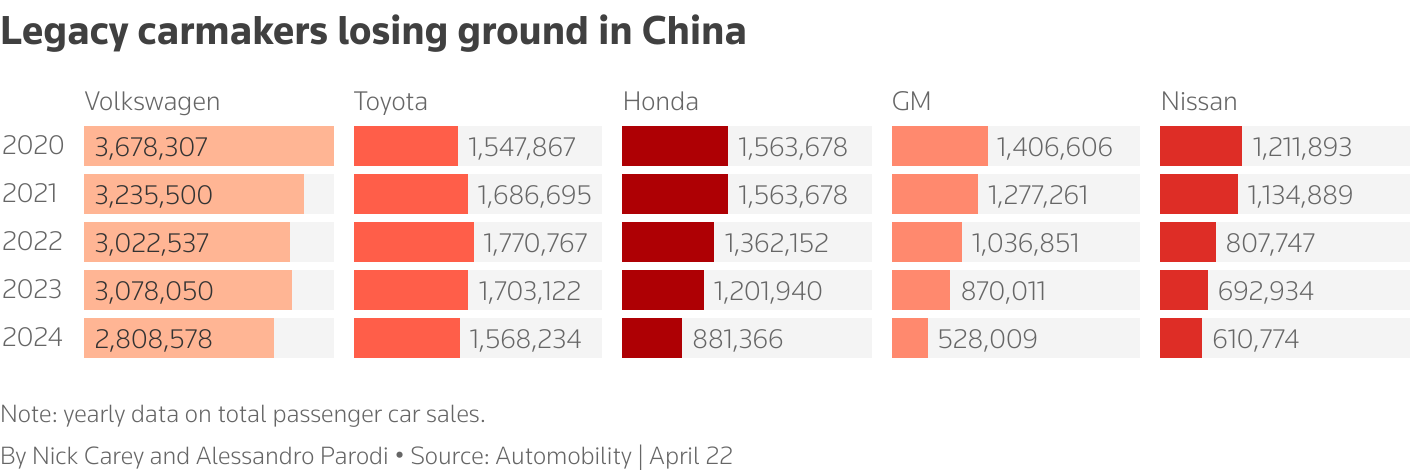
Second, there are consistent indications that oil demand has not only slowed in China, but that the radical transformation of its transportation sector to the electric platform has mostly killed growth for road fuel (gasoline and diesel). If that sustains itself, and there’s a good chance it will, then there’s a good chance that further increases in global demand will become quite constrained. There are many perspectives on China’s oil demand one can call upon, but one lens is to take note of the steep decline in the volumes of cars being imported into China from other automakers around the world. This recent story from Reuters, Even Porsche can't find its lane in China as foreign automaker sales skid, helps us understand that China’s vehicle market has swung so hard, so completely towards EV that global automaker’s don’t stand a chance now to compete, as they remain far behind. The internal combustion engine vehicle no longer has a future, but it seems many OEMs completely misunderstood the timeline to that outcome was far more compressed, far more rapid than they assumed.
There is absolutely no prospect at all that global oil demand will decline anytime soon, nor will it embark on a declining trend. The best we can hope for in the medium term is that growth ends, and lapses into an oscillating plateau. Given that we’re only 2.2% above the demand level of 2019, there is also a good chance that plateau has already begun. From an emissions perspective, that’s both necessary but insufficient of course to kick global emissions lower. As Cold Eye Earth often reminds, declining emissions can be achieved only when the technological advances that drive energy transition are paired with aggressive and punitive policies taken against existing, incumbent energy sources, and the devices or machines that are designed to use fossil fuels. Absent such an approach, energy transition will carry on as it is presently: meeting marginal growth with new energy technology, while legacy sources stay embedded in the system.

The steady drumbeat of annual economic growth is far more deterministic of energy transition’s future course than the deployment of renewables. In 2023 for example, the world consumed 620 EJ of energy from all sources, of which 51 EJ were renewables. Just a 2.0% advance in total global energy demand would add 12 EJ to the global total therefore, but for renewables to add that same amount would require 24% growth. Yes, a small thing growing at a fast rate can be quite powerful over time. But a very, very large thing growing at a far slower rate can be formidable. And now the corollary: a decline in economic growth could be far more effective in any given year in curbing emissions, than any additions to the growing renewables base. So, energy sector observers need to pay more attention to generalized growth of the global economy.
The IMF late last month unsurprisingly downgraded its 2025 forecast of global GDP to 2.8%, after having started the year forecasting around 3.3%. As we have joked previously, Trump’s economic policies in the aggregate have slowed, not boosted, global growth prospects making him an accidental contributor to what will likely be slower global emissions growth—at least for this year. Yes, he is at the same time hurting prospects for renewables growth, but only in the United States—not elsewhere. Unless the administration fully climbs down from its doomed tariff policy, then emissions growth in 2025 is highly unlikely to match or exceed last year’s advance of 0.8%. And this will also lower the hurdles renewables face as they are still trying, unsuccessfully so far, to cover total marginal growth in global demand.

Predicting peak emissions increasingly looks like a form of pseudoscience, and it’s notable to observe the think-tanks who wisely avoid the practice. Readers will recall the peak oil movement, and in particular Marion Hubbert’s calculations that attempted to evoke a bell curve that would have predictive value. But it didn’t have predictive value. Followers of Hubbert, and those today who serially call for peak emissions, make a similar mistake in which they use recent information on which to extrapolate their forecasts—but information, no matter how recent, simply doesn’t unlock those secrets.
When peak oil theory made a comeback in the early part of this century, this meant that followers were, unwittingly, locking themselves into a never-ending refrain of “maybe next year.” Just to say, your faithful correspondent was also persuaded initially by the theory, given that global oil production failed to respond to higher prices for five straight years, from 2003 - 2008 (and actually declined). And then came the tight oil revolution, and the reminder that humans are damn clever, and as a result the earth has too much, rather than too little, fossil fuel resources.
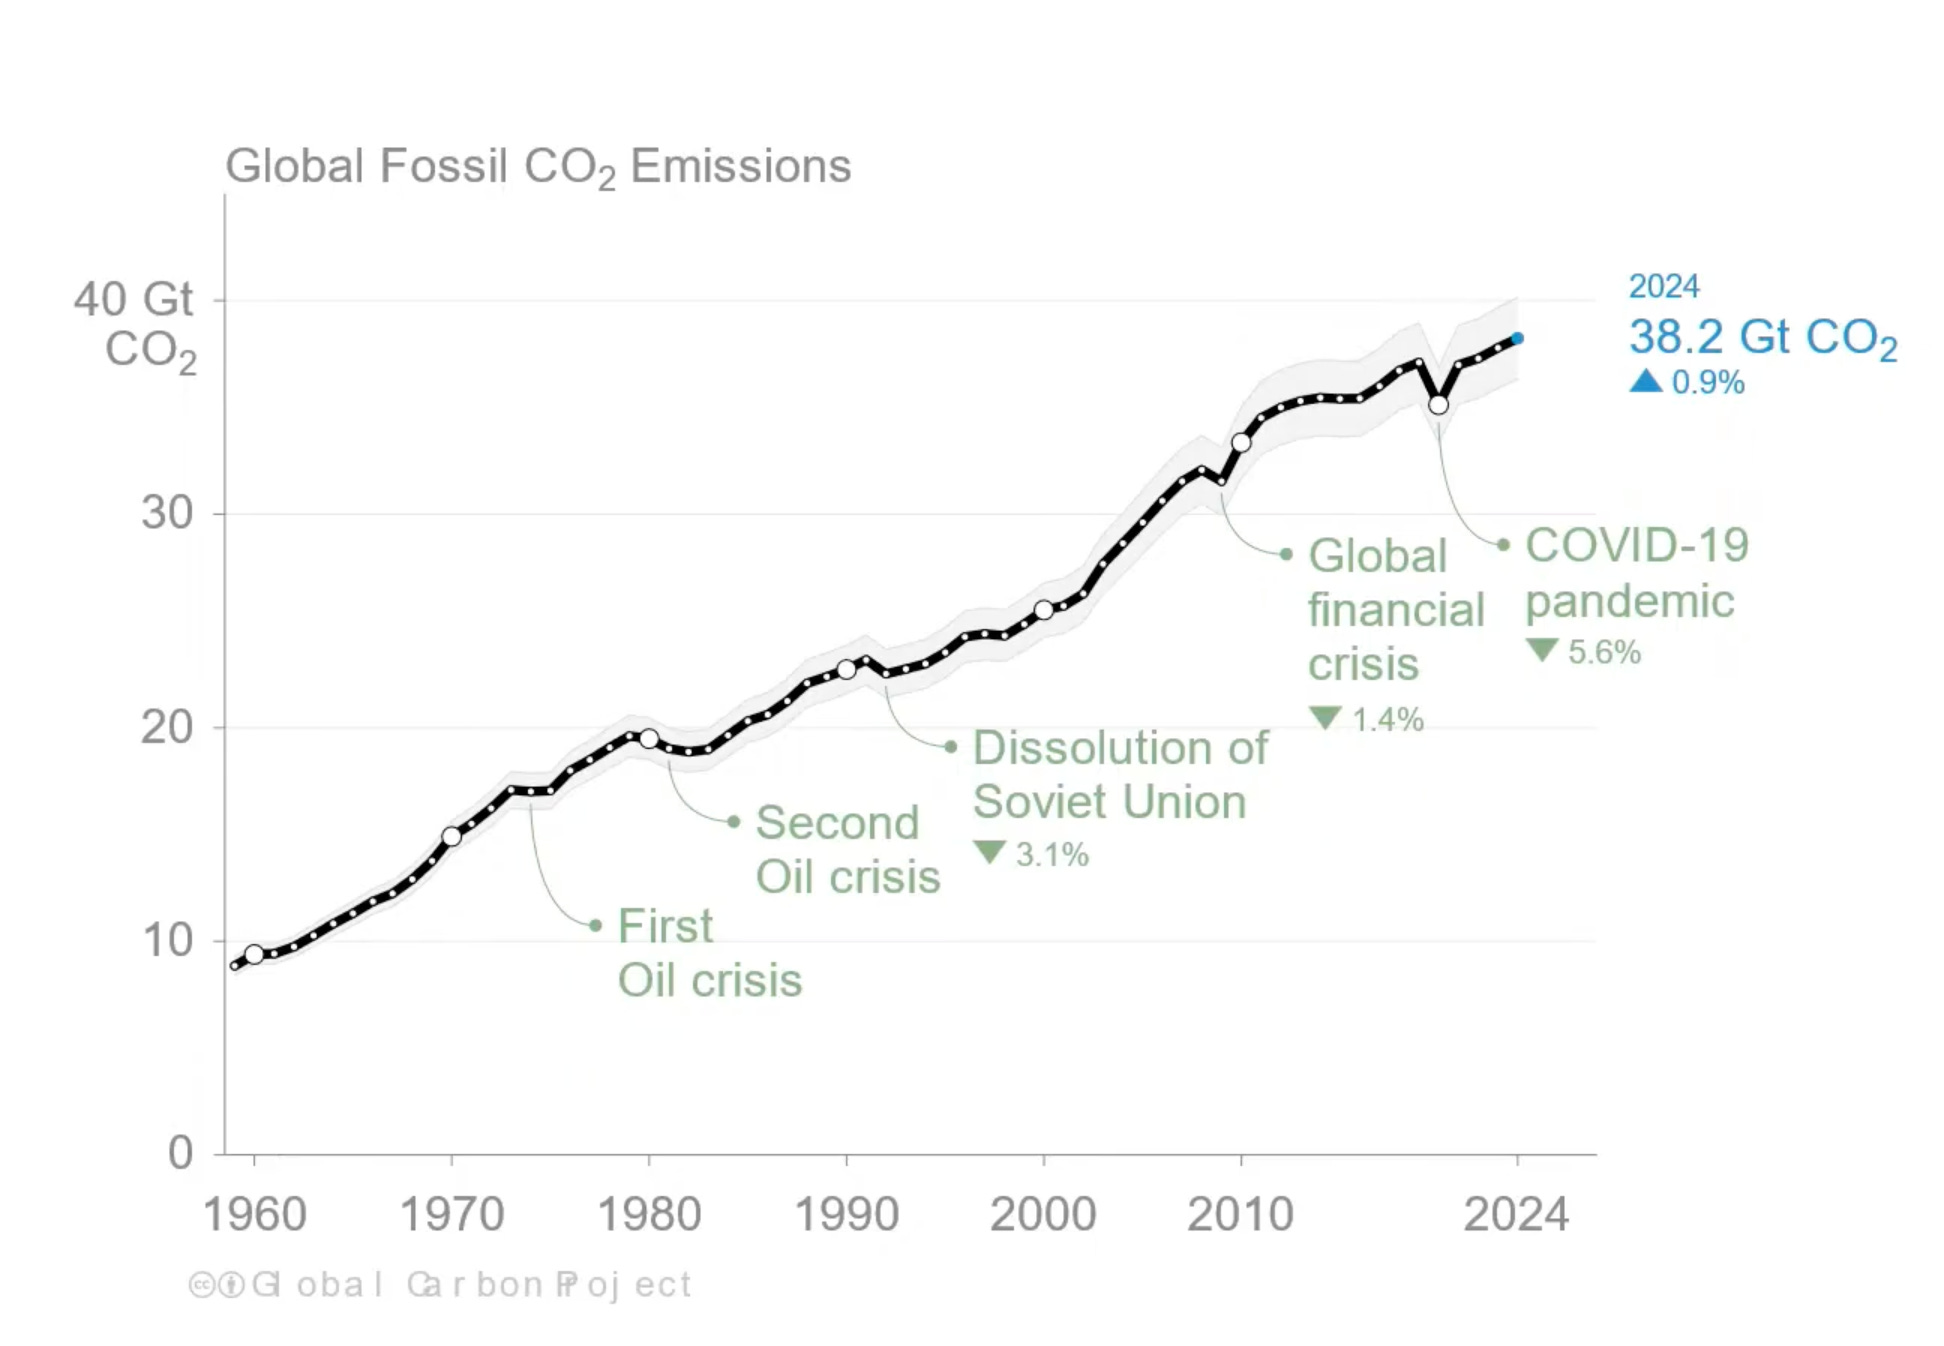
One think-tank that’s been admirably steadfast in not making peak predictions is CICERO, based in Oslo, Norway. Recently, CICERO’s Robbie Andrew gave a nice update on the global emissions picture, and you can watch that clip on YouTube. One useful point Andrew makes, is that when we look back over the past half-century, the only times global emissions decline is during crises. Indeed—because the only time economic growth contracts is during these crises. | snapshot from Andrew’s talk:
Let’s also place here additional commentary from a Glen Peters, a colleague of Robbie Andrew, at CICERO. The image below has been linked to the original on BlueSky. Note again the familiar theme: economic growth is hard to overcome.

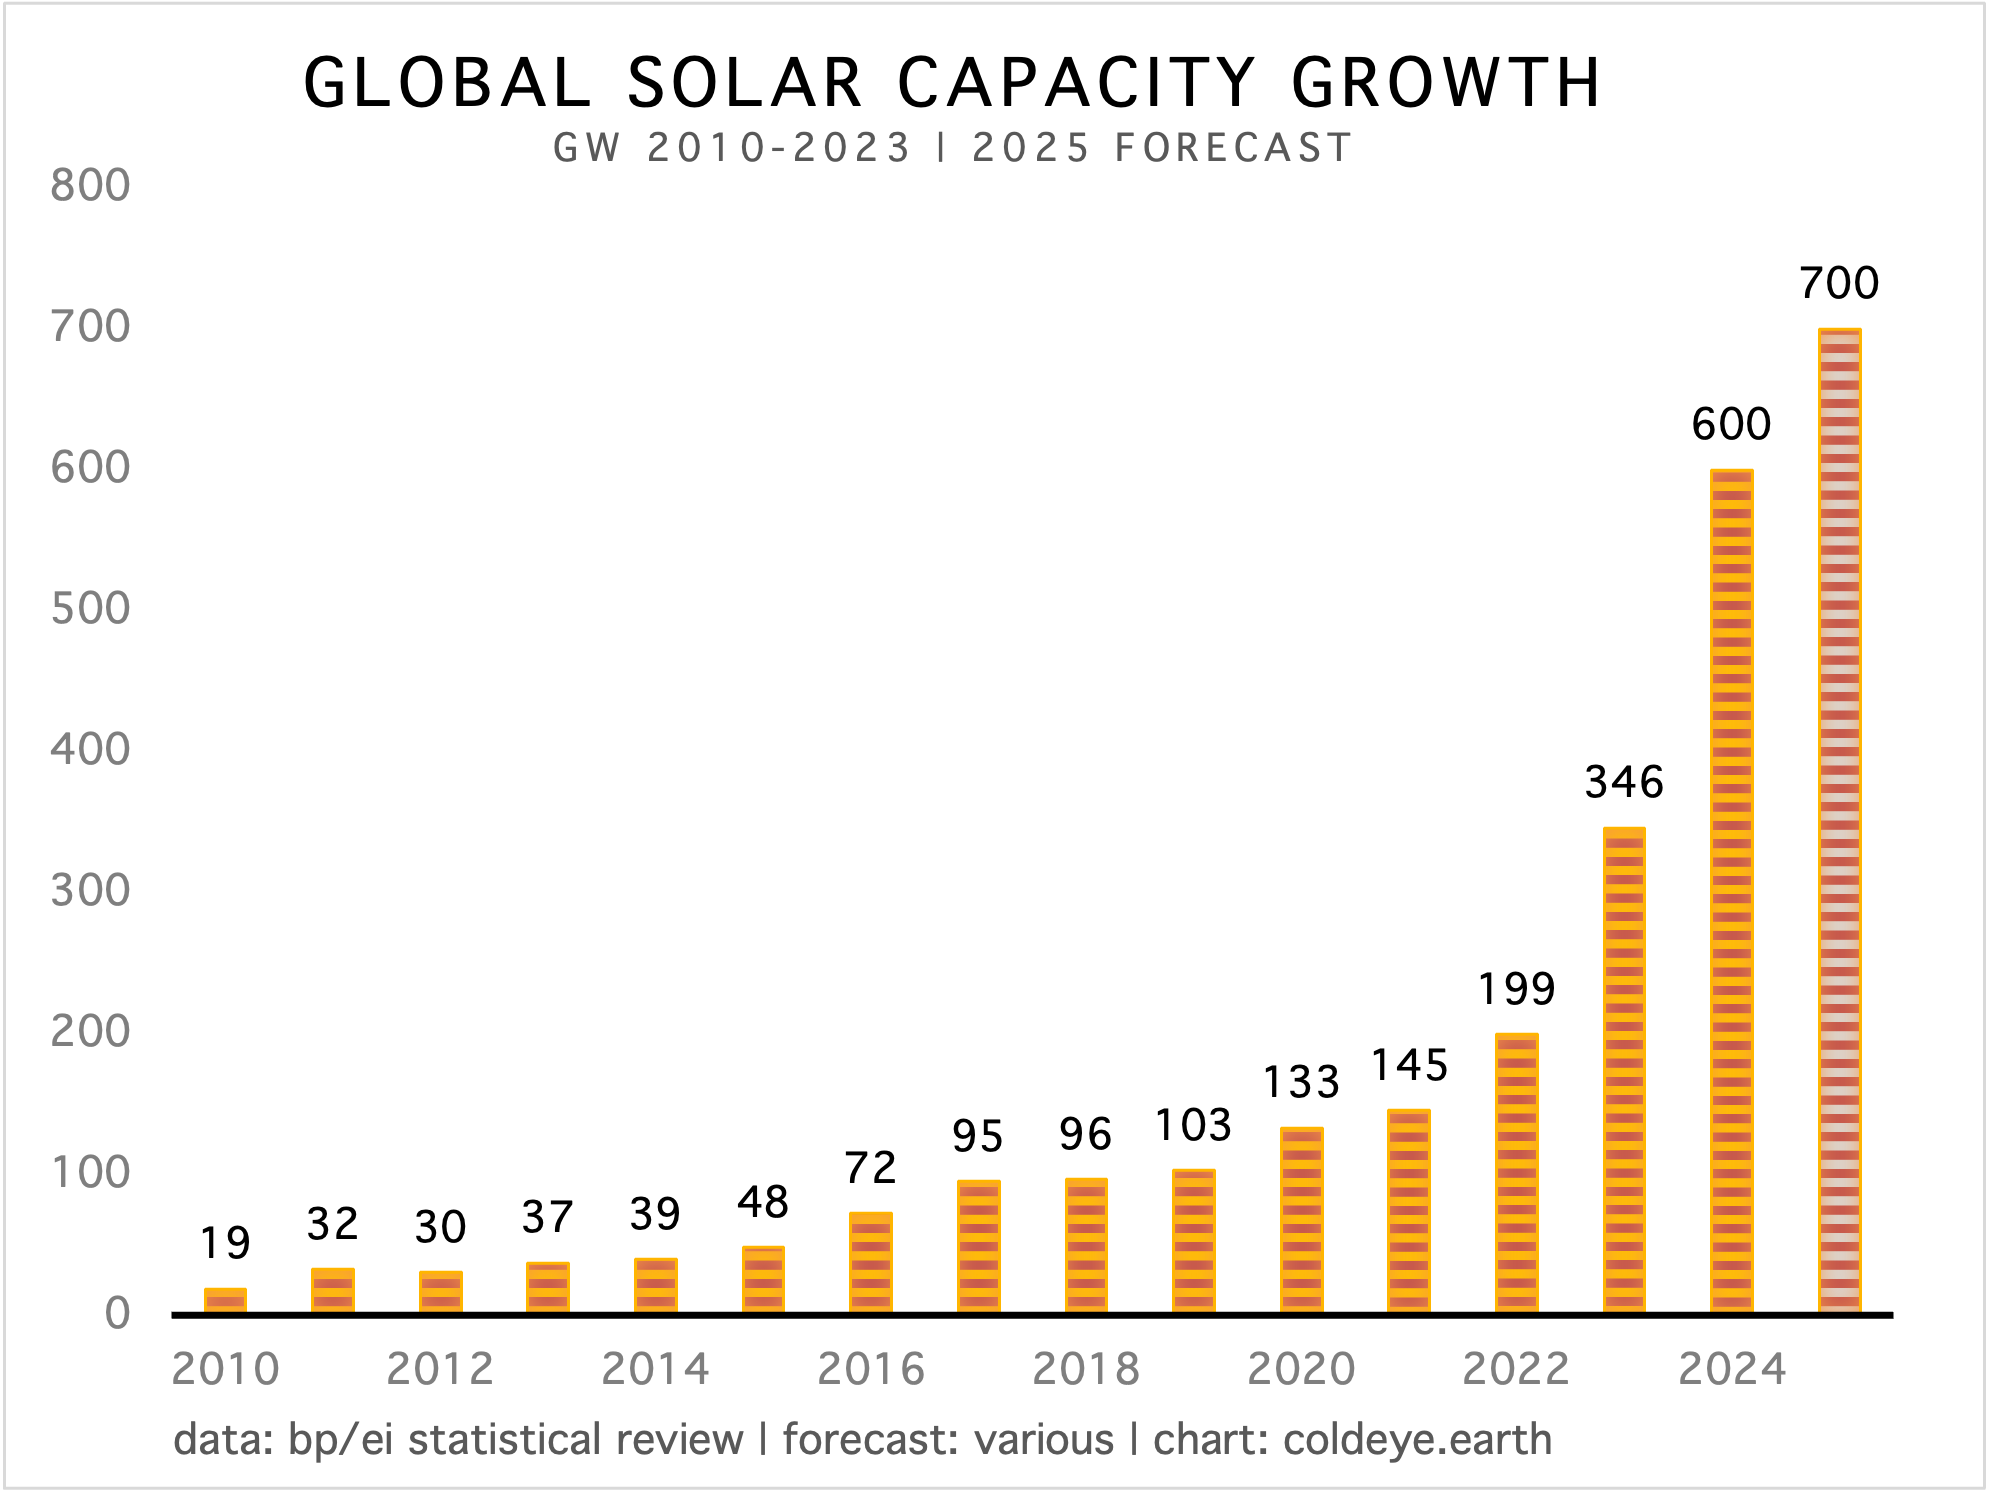
Global solar growth continues to amaze. Current estimates are that capacity additions were near/at 600 GW last year, and that the world will build an additional 700 GW this year. The only growth constraint that still exists for solar (having knocked down all its previous barriers quite nicely) is the enduring economic competitiveness of existing, incumbent generation from coal and natural gas.
If we add just one inch of dirt to the entire surface of the earth, how much dirt would that be? This is indeed an odd question, so why ask it in the first place? Well, because this seems a great analogy to the problem of annual, global energy demand growth. The world economy is massive, and when it grows just a little, it drives aggregate energy demand forcefully.
Using Anthropic AI, the following answers were obtained:
The Calculation:
First, let me find Earth's surface area:
Earth's surface area = 4πr² where r = 6,371 km (Earth's radius)
Surface area = 4π × (6,371,000 m)² ≈ 510.1 million km²
Converting one inch to meters:
1 inch = 2.54 cm = 0.0254 meters
Total volume of dirt:
Volume = 510.1 million km² × 0.0254 m = 12.96 million km³
That's approximately 13 million cubic kilometers of dirt!
Comparisons to put this in perspective:
Your inch of dirt would be roughly 3 times the volume of the Mediterranean Sea or about 590 times all the water humans use globally in a year.
—Gregor Macdonald