


The just released Statistical Review of World Energy from the Energy Institute confirms that the additive model of energy transition maintains its grip. Last year, wind and solar dominated marginal growth of world energy demand, making the largest contribution to new energy supply. Yet, fossil fuels continued to grow, leaving their existing underlayer untouched. The result once again is that renewables continue to play an additive role, helping to serve growing demand but never eating into, or disrupting, the still much larger role of fossil fuels in the global economy.
The additive model of energy transition is rock solid as a descriptive heuristic, but one has to be careful about deploying it as a predictive tool. Over the long run, the existing fossil fuel base will eventually erode, and renewables (wind, solar, and storage mainly) will surely cross over from their additive role to a far more disruptive role, in which they meet not just marginal growth, but degrade the economics of incumbent energy providers, forcing more rapid retirements, and substitutions. It has been about two years now since Cold Eye Earth abandoned the outlook that this cross-over was imminent, and adopted the additive model as the best guide. And there is still no reason to think that the additive model will spoil, anytime soon. (more on this later).
Many energy observers are hostile to the additive model because, as a guide, it is far better and more accurate than their serial, year-after-year predictions of the demise of fossil fuels. In the view of Cold Eye Earth, it may not have occurred to these observers that the additive model is highly aware, and uses history to demonstrate that nearly all energy sources over the past several hundred years have reliably continued to grow, even when specific energy sources fall out of favor. Did oil overtake coal in the 1960’s to become the world’s primary energy source? Indeed it did. And did coal consumption growth slow down alot? Yes, that too. But did coal ever stop growing? No, unfortunately, it did not. And coal demand, both in the power sector and more broadly, is still growing. Global coal demand hit a new all-time high last year.
Our first view of last year’s data comes through the comprehensive chart showing the marginal contribution each energy source made to 2025’s growth in global energy demand. Here, you can easily see that renewables is taking a leadership role, on a relative basis. Cold Eye Earth is not a fan of the “renewables” category because it adds the tiny contributions of geothermal and biofuels to the far larger output of wind and solar. The alternative view of this category is that, when tallying up global energy contributions (and not just the power sector), it’s useful to bring these junior partners into the category. Here is last year’s scoreboard:
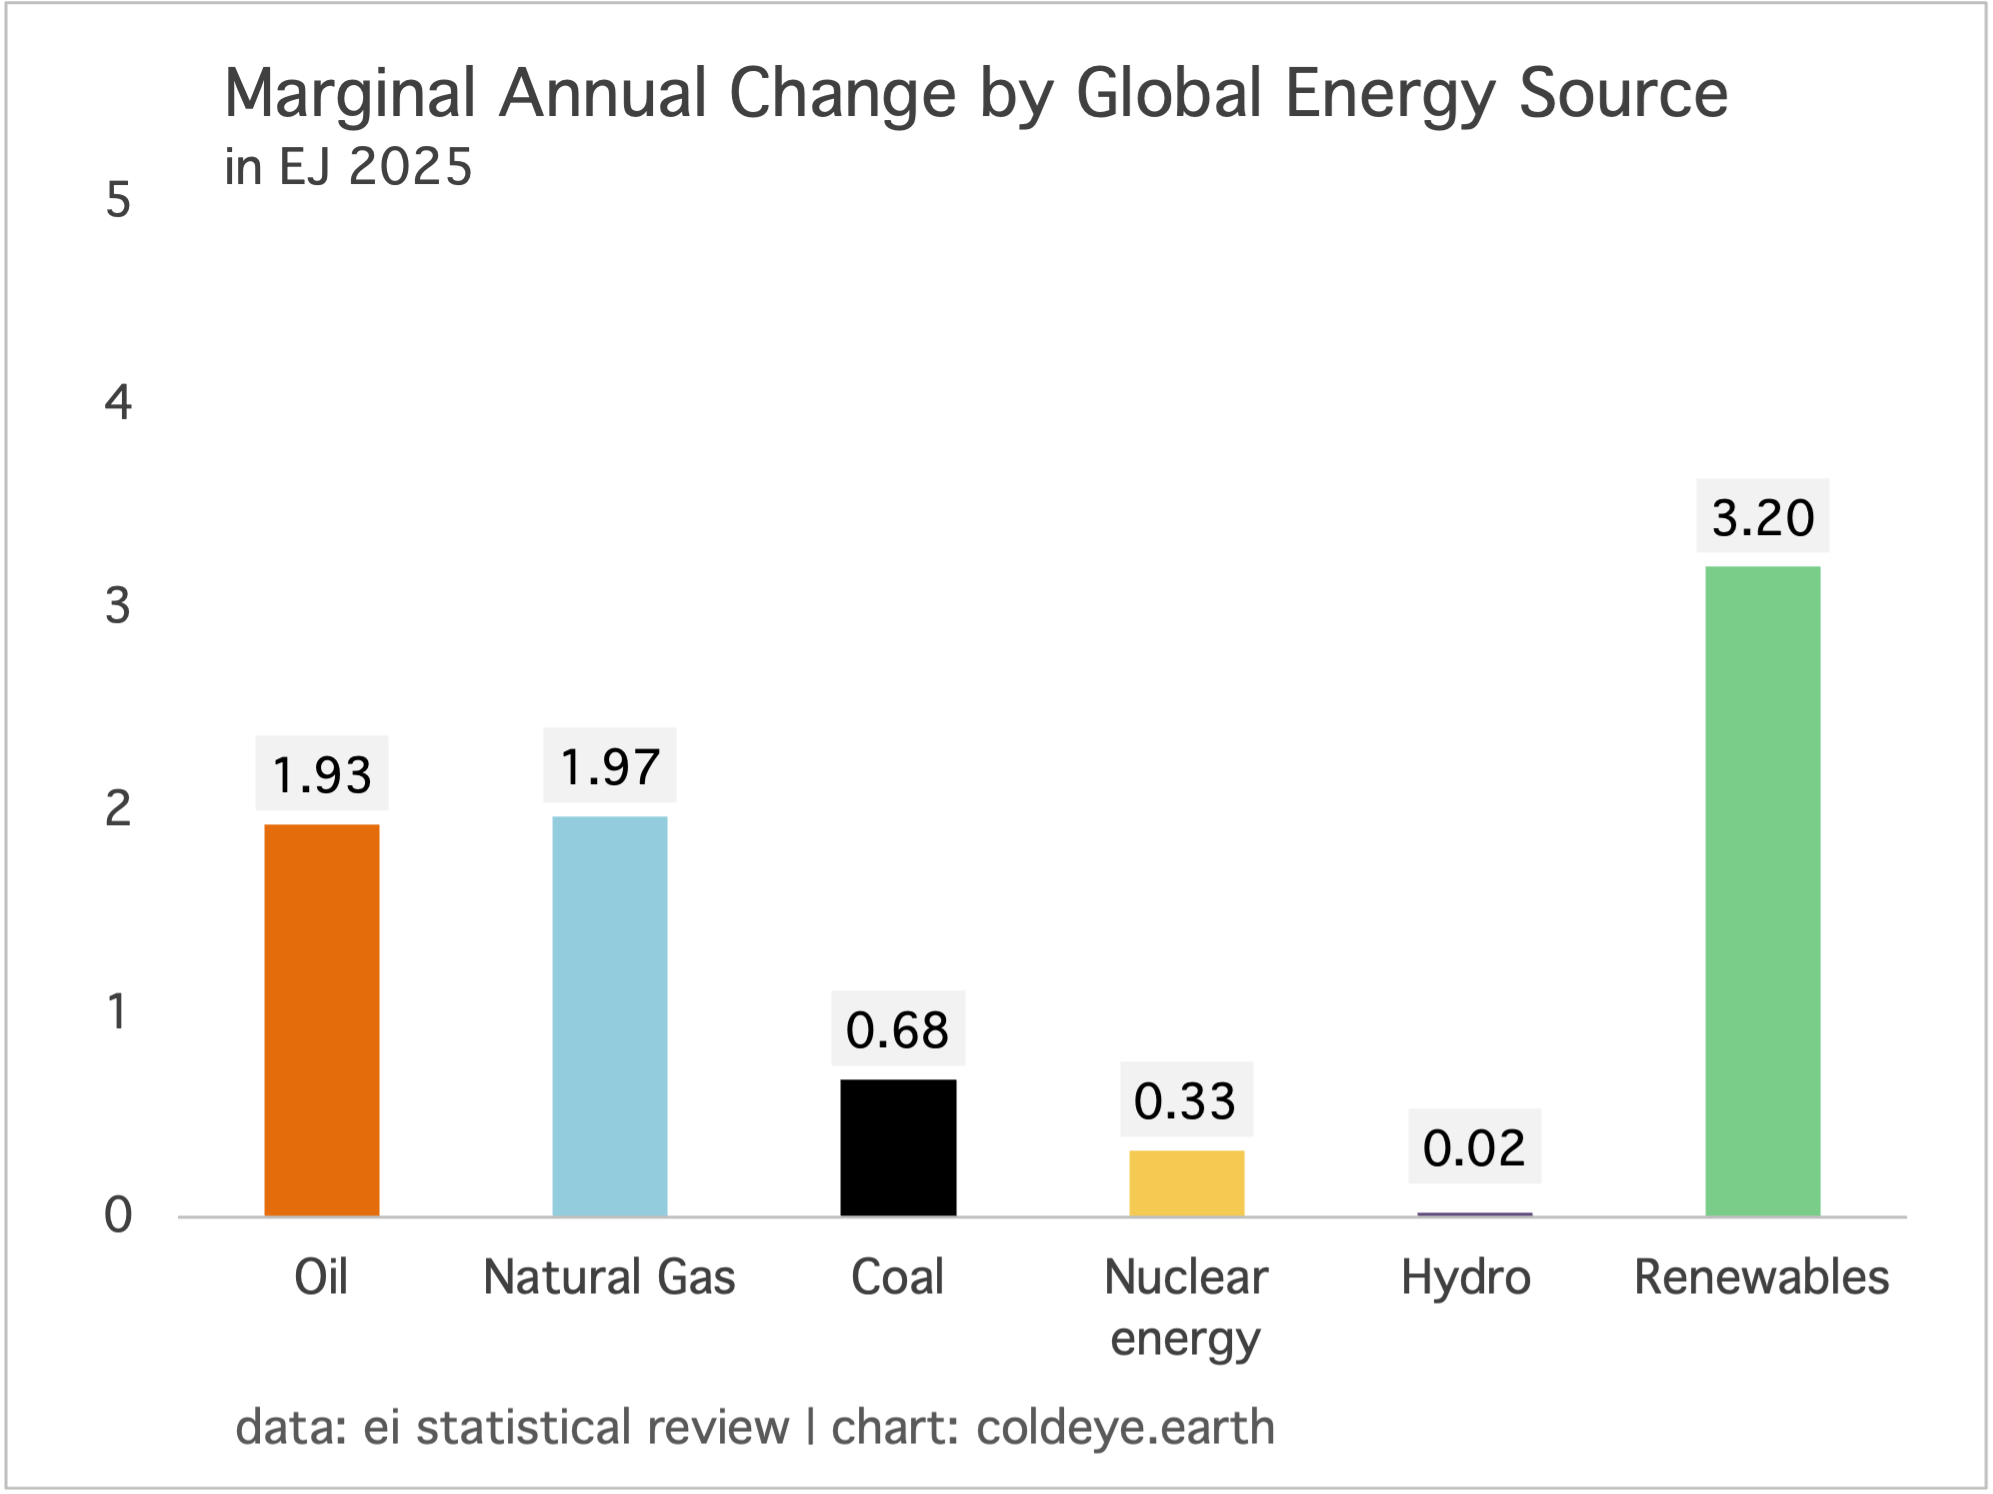
Although we must be cautious about using the additive model as a predictive guide, you can see pretty easily how those making that argument currently have the data on their side. The argument goes like this:
Just as the historian Jean-Baptiste Fressoz laid out in his book, More and More and More: An All Consuming History of Energy, every time a new and successful energy source is introduced to the world, (coal, then gas, then oil, etc), that energy source starts to dominate marginal annual growth but all the other, existing sources continue to grow. In other words, energy history is a story of layers, one stacking on top of the others, forever. We should expect the low-carbon revolution to follow the same path. Clearly renewables are dominant now in marginal growth, and while further growth of oil, natural gas, and coal will certainly slow down (and already has), actual, outright declines in those fuels will remain elusive.
As Cold Eye Earth has observed previously, the common blind-spot among climate hawks and renewables advocates is the factor that lies at the heart of the additive model’s competitiveness: economic and population growth. The global climate community is itself dominated by a view that fails to pay enough respect to economic growth, and is always and ever over-persuaded by the fact that wind and solar growth is in insane mode. In doing so, they leave out the most controlling variable to energy transition. It is absolutely wonderful that wind and solar and storage growth rates are on fire, and their insane mode growth is sure to continue. They are at least tamping down the growth of fossil fuels, and for this we are thankful. But none of that success amounts to a rebuttal of the additive model. They are instead confirming its thesis.
We should be less concerned about the ability of renewables to halt the growth of fossil fuels on a global scale, and far more concerned about their ability to compete in their own, specific lane: the power sector. No one expects renewables to pull down the growth of all carbon sources to zero just yet. We are still too early for that, with myriad sectors from steelmaking to cement and other heat-based industrial processes still bereft of any scalable alternative. So let’s not make the hurdle too high for renewables with taunts and criticisms that they “still only make up 5.9% of total global energy demand.” Listen: nuclear power only makes up 5.2% and hydropower just 2.7% of global demand, and no one is suggesting these are scams or failures, right?
Indeed, this is a good occasion to point out that the vast majority of the criticism against renewables is just nonsense and idiocy. These lines of attack come from those who don’t understand growth, and who cannot comprehend large systems and how they change over time. This impulse far outweighs the tendency of climate folks and renewables advocates to play loose with the data to tell happy stories that have yet to come true.
With that brief assessment out of the way, everyone needs to face up to this:
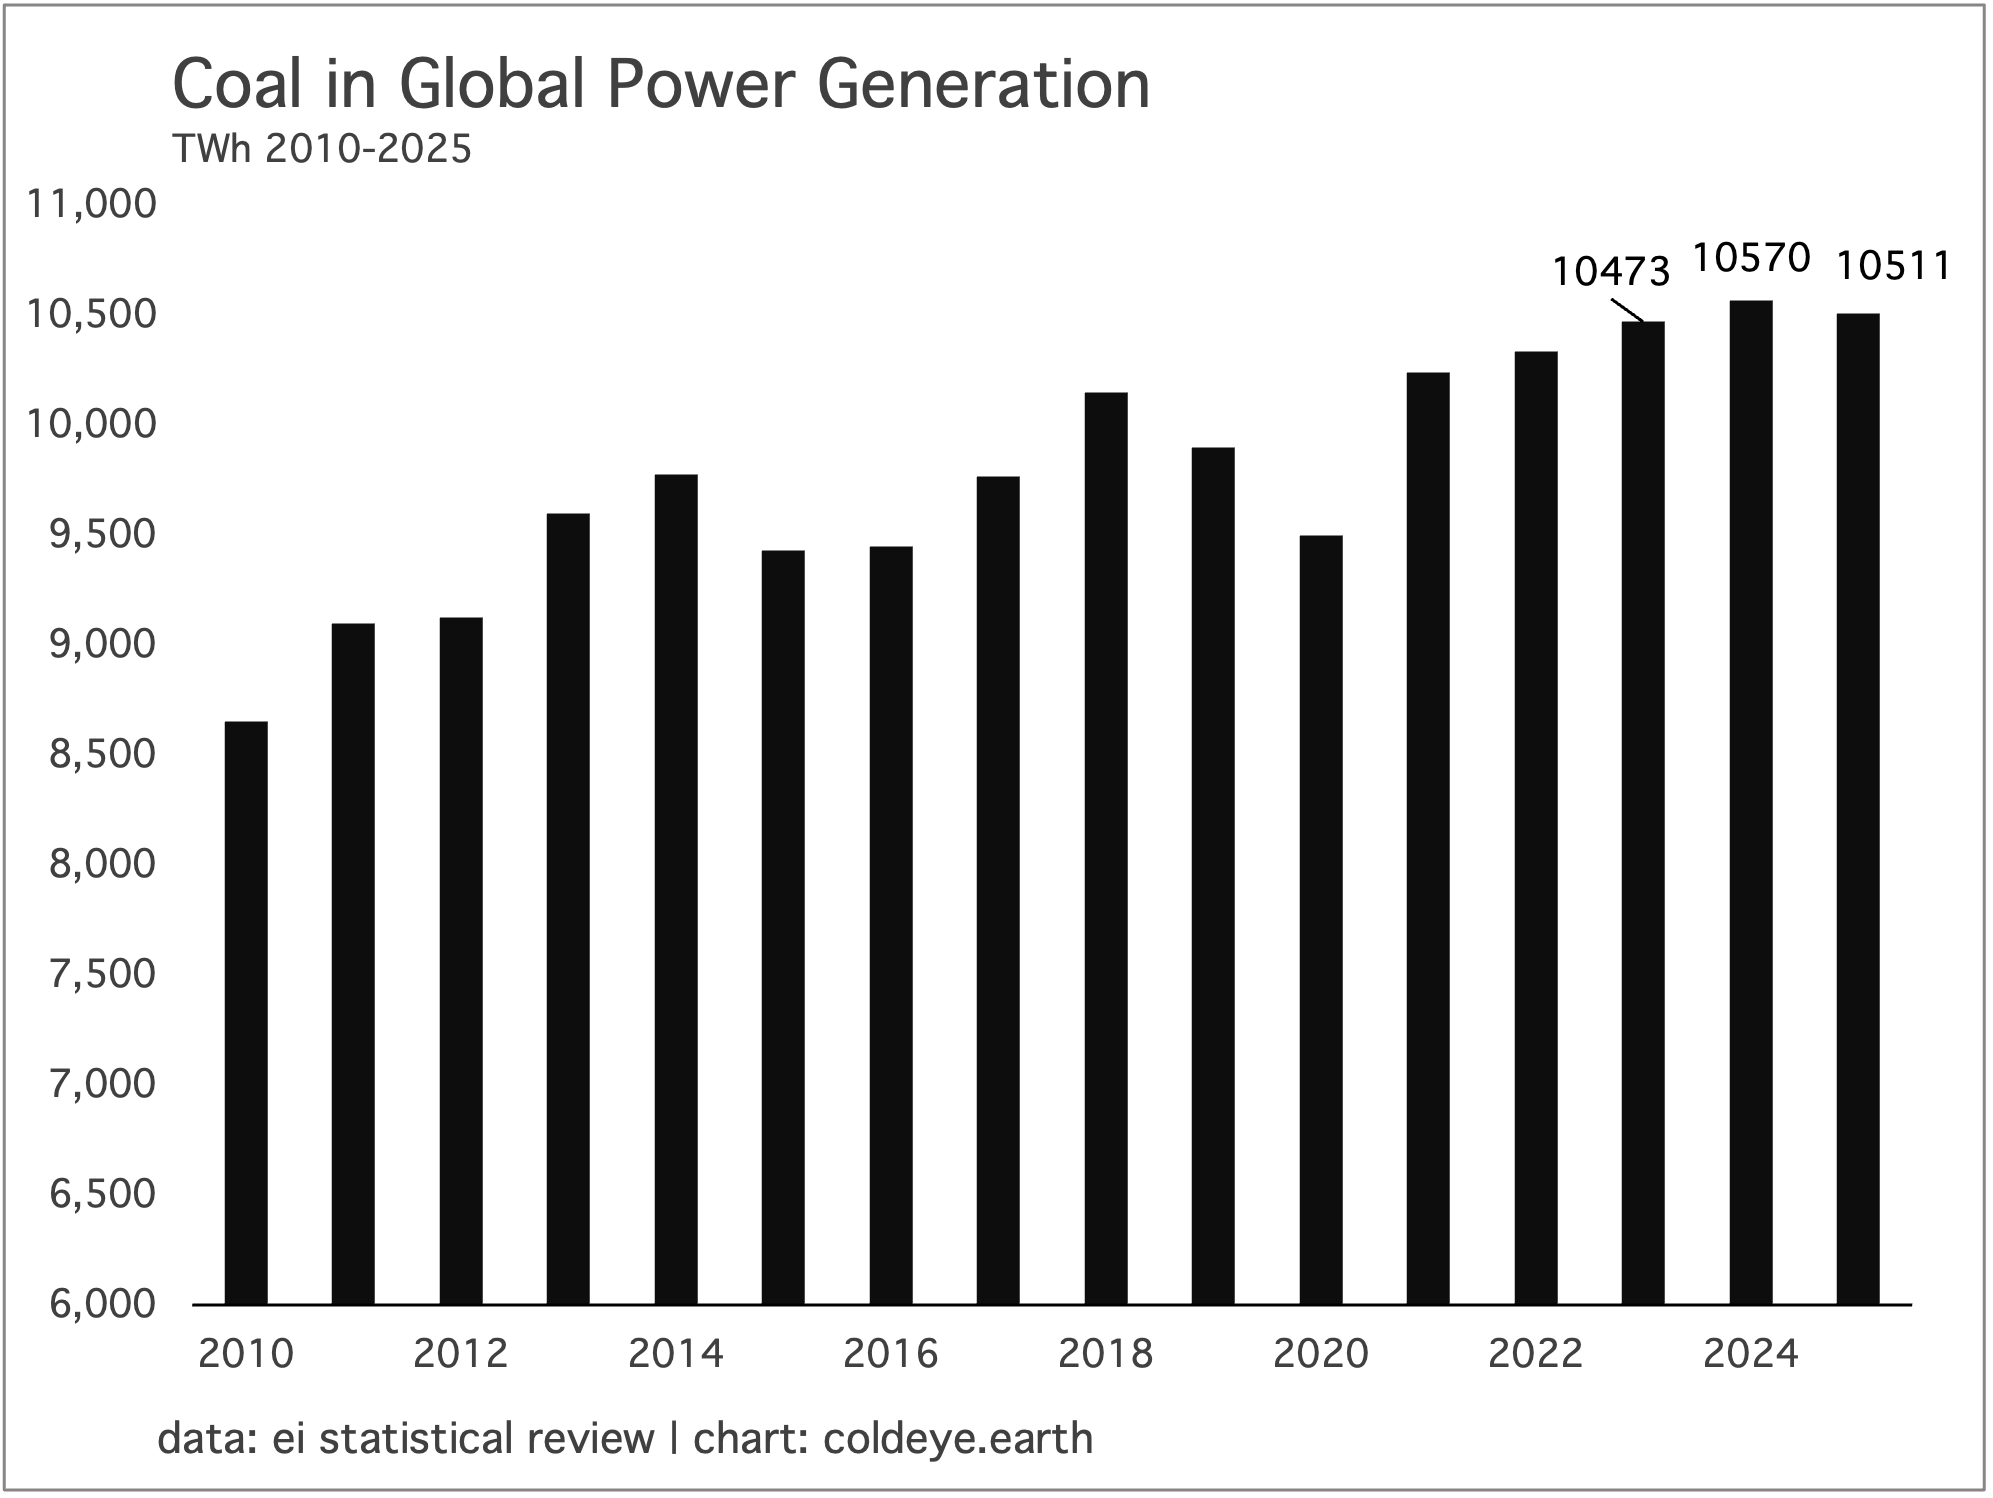
Despite a very successful, decade-long campaign in both Europe and the U.S. to drive out coal from their respective power sectors, global coal in power continues to grow, having hit a new all time high in 2024 at 10,750 TWh and easing last year by a scant 0.56%. Indeed, coal has absolutely crashed in the U.S. from providing half of all power supply to less than 15% of power, as natural gas alongside wind and solar have soared. Combined, the EU and the U.S. have shed nearly 1500 TWh of coal-fired power since 2010. Wow! But in that same period, global coal-fired power has advanced over 1800 TWh, not just entirely erasing the combined EU-U.S. retirement wave, but actually adding to the consumption total. In other words, in the period from 2010, which Cold Eye Earth uses as the starting line for the big global push into wind and solar, coal was able to not only survive an enormous loss of demand from the OECD, but grew so quickly in the Non-OECD that it outcompeted wind and solar consistently for a large portion of marginal power sector demand.
Peak coal theory, therefore, can now be considered a total failure. Indeed, even in the sector where wind and solar are most competitive, coal continues to press onward. It doesn’t matter one bit that coal crashed in the EU and the U.S. Those crashes say nothing about coal’s capability to keep growing in global power. You can nitpick and data hunt all day long, convincing yourself that “with all the coal retirements and now China easing back on coal that surely peak coal is finally here” but unfortunately that theory has been hanging around for more than a decade. Indeed, we all thought coal had peaked back in 2014—both globally and in the power sector. We were all wrong.
Global wind and solar continued their relentless march forward last year, nearly providing 100% of marginal growth in global power. That is both extremely impressive, while also being a perfect portrait of the additive model of energy transition. Coal inputs to global power fell by a half a percent; while natural gas inputs to global power rose by roughly the same amount, 0.6%. There is no trend, no data point, or any other reason to believe that coal and natural gas won’t either continue to grow in power, or at the very least, hold on to their current position for a while yet. This is exactly the outcome that the additive model describes, and at some point, we may want to admit the additive model does have some predictive power.
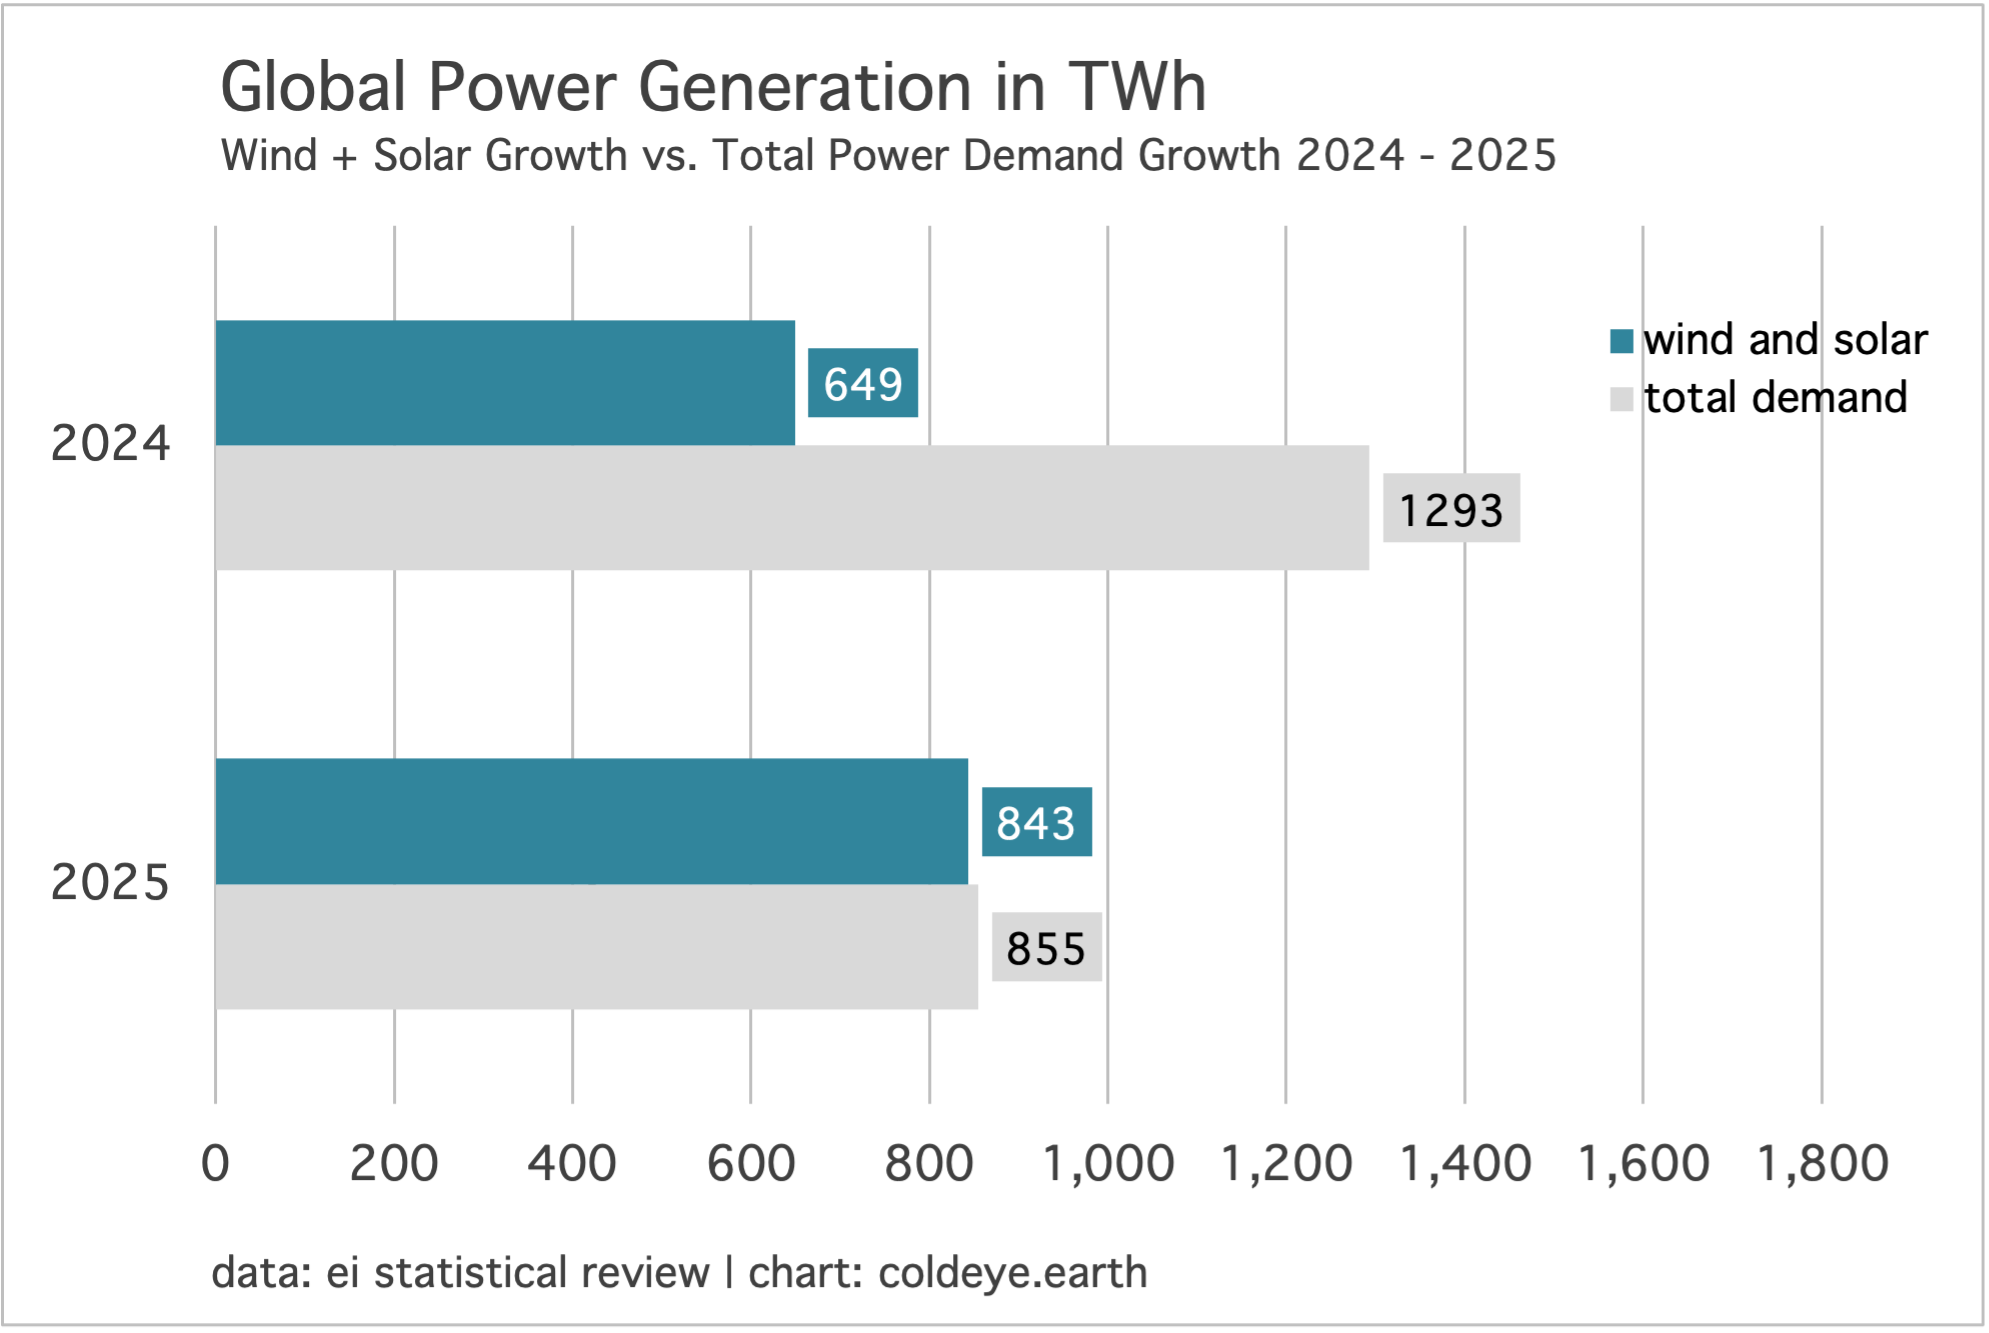
As you can see, combined wind and solar absolutely smothered all marginal growth in global power last year. Even more impressive is the leap from covering just half of marginal growth in the year prior, 2024. Well, it’s impressive until you observe that total demand growth actually fell last year compared to 2024, only reaching 855 TWh. That made the hurdle far easier for wind and solar. Nevertheless, you would be surprised how many will defiantly conclude that, based on one year’s performance, combined wind and solar are on the verge of overrunning the system—not just covering marginal growth, but eating into the fossil fuel underlayer. Advice: don’t do that.

There are a number of reasons why the additive model may continue to work as a predictive tool specifically within global power, at least for another three to five years. Let’s go through them.
• Energy transition by its very nature is all about bringing economic activity over to the electricity system. This supertrend now has a new entrant: data center growth. Together, the years like last year when total demand growth was lower than the prior year will be rare. We have entered a new domain of above average growth in electricity demand.
• The economic viability of existing natural gas power and coal power continues to stand as an immoveable wall. Retirements are not numerous enough, and wind and solar may win the bidding for all new power capacity in some domains but we don’t care about “some” domains. Clearly, coal is still competitive enough to get built, and in systems like China—where vast, untapped coal capacity is always ready to be placed into service—the upward risk of coal-fired power during hot summers, cold winters, and stronger manufacturing remains.
• Natural gas remains dirt cheap. Not a single analytical forecast about the economic viability of shipping LNG ever came true. In fact, natural gas is not just globalized through LNG but the LNG market is robust. So even in a plausible world where coal starts to (finally) die by entering sustainable decline, wind and solar would still have to share the playing field with natural gas. And North American natural gas remains plentiful, and mind-blowingly cheap.
• No large country or domain has embarked on an aggressive path to actually shutter economically viable coal and natural gas power capacity. Sure, OECD countries have deployed small versions of this effort through incentives, tax breaks, and other policy preferences. Outside of emergencies though, it is very, very hard for democracies to force losses onto the private sector. Without such aggression, therefore, we are all standing around waiting for the existing global fleet of power to age out on its own timeline. And you can already see what that outcome looks like: it looks exactly like the additive model says it will look.
• There’s a huge misunderstanding about the affordability of wind and solar and storage. Yes, they are cheaper than building new coal or new natural gas in many domains. But they are not dirt cheap. Dirt cheap is the input to truly revolutionary change. Compared to their energy content, coal, natural gas, and oil were dirt cheap in their day and except for periodic crises, they remain dirt cheap. A good definition of dirt cheap: so cheap, that the new entrant not only delivers high value to the end user, but in doing so funds its own growth. Tech revolutions are born when a new tool offers more service than the old tool, at a lower price. That is the killer combination no one can fight. Wind and solar and storage, despite wishes, dreams, and yearning, are cheap—just not so cheap that they can invade without resistance.
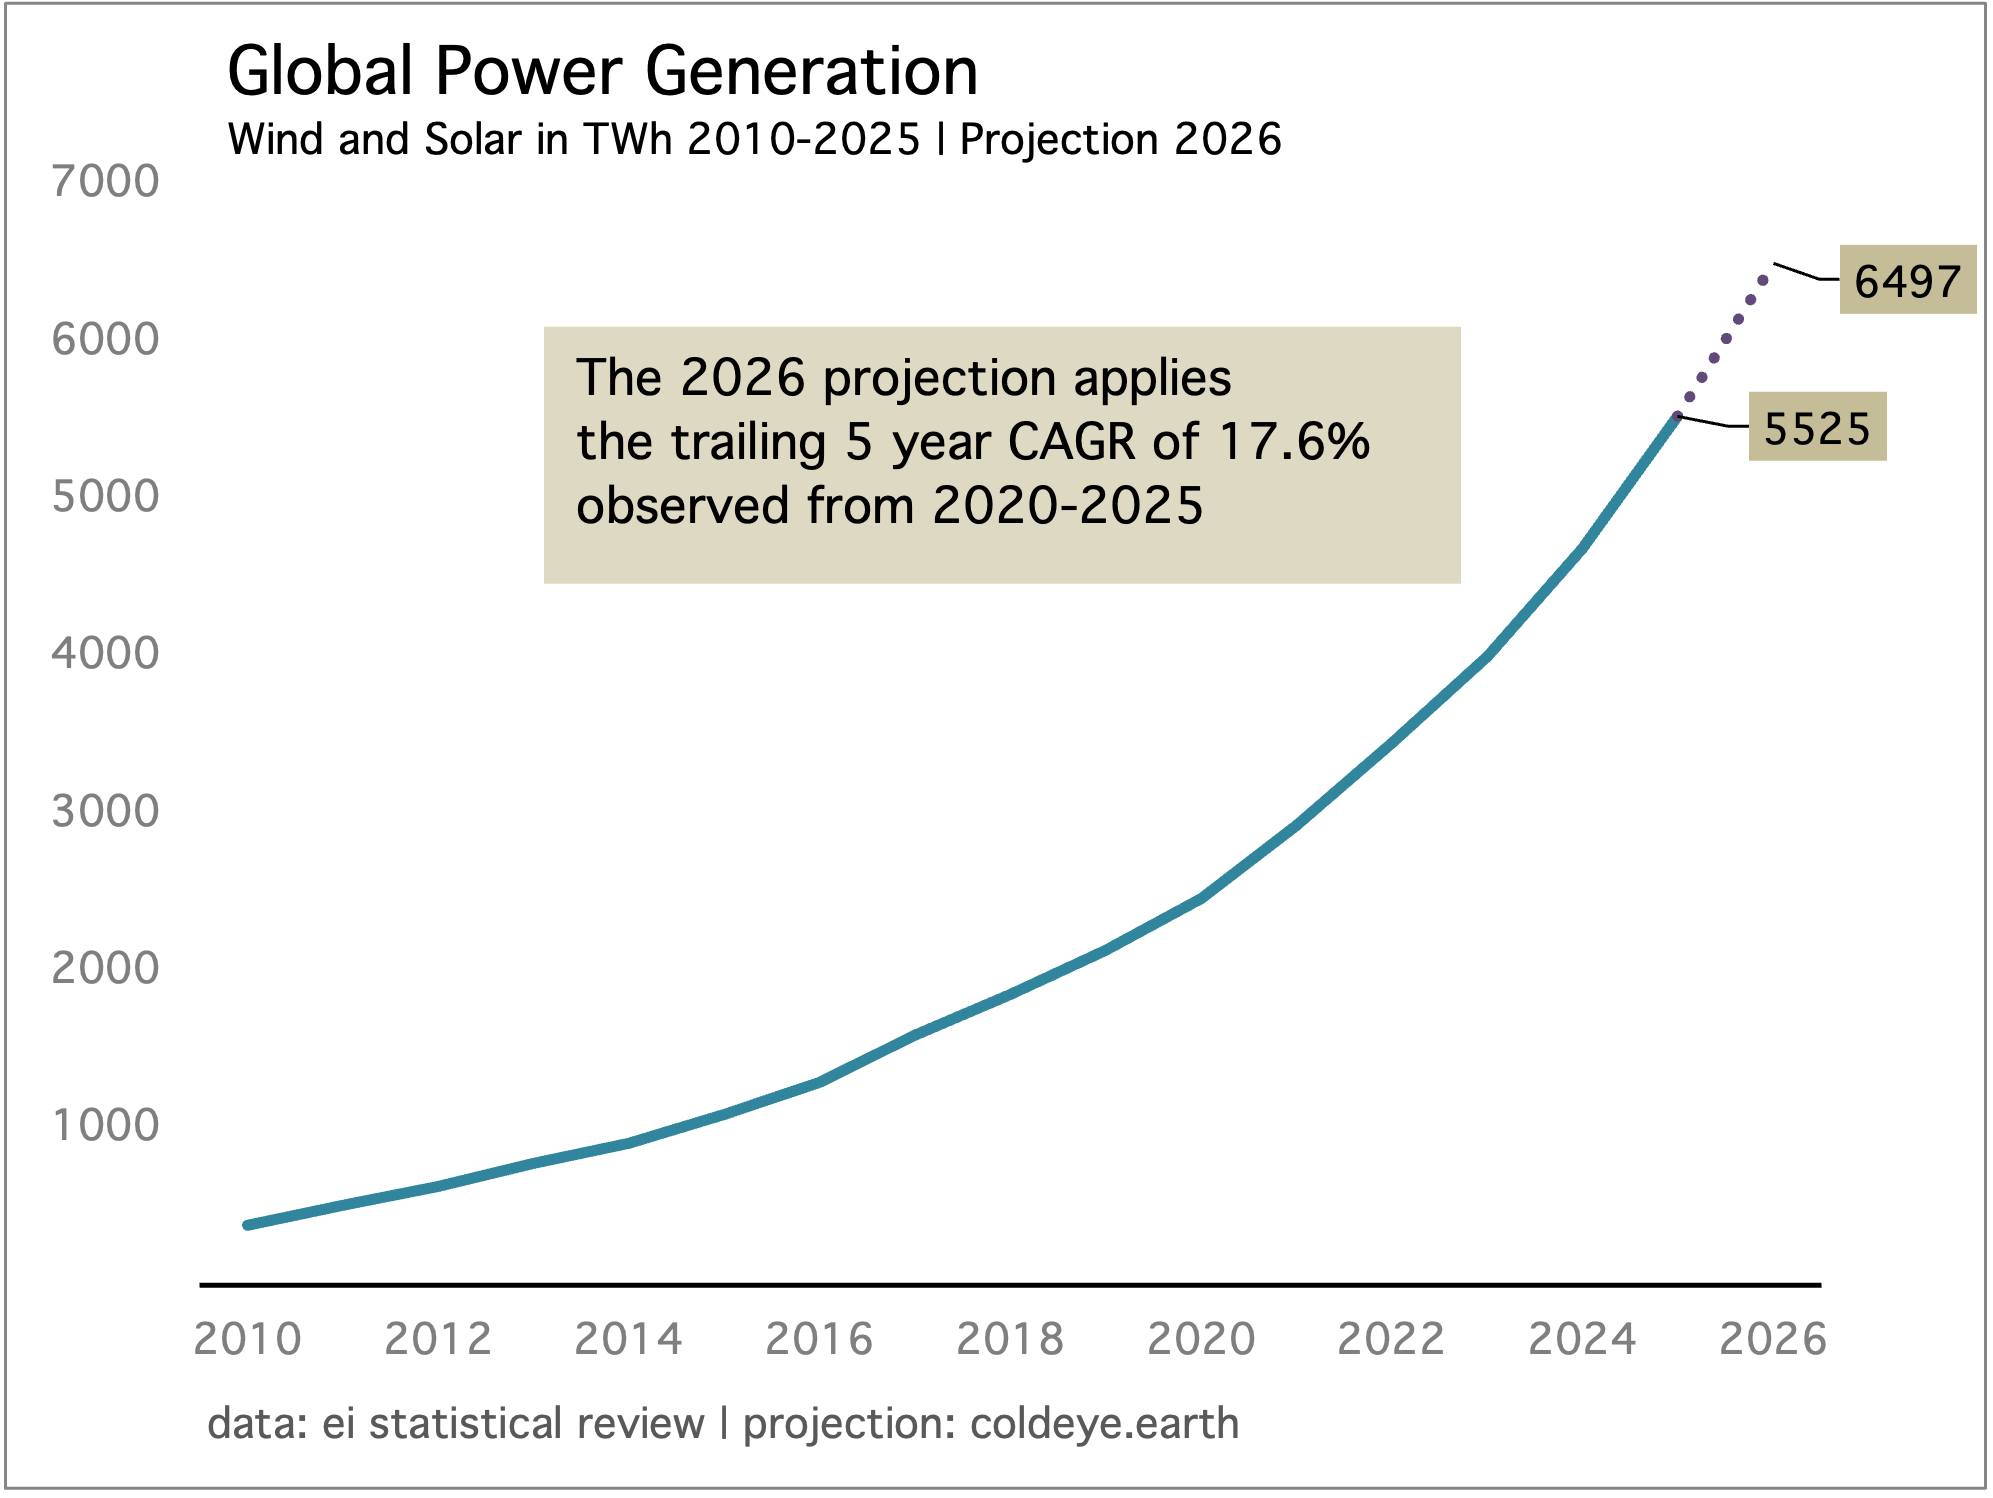
Cold Eye Earth continues to use a very simple model to forecast total annual growth from wind and solar power generation. And it’s almost comical how well this has worked the past few years, given the formula. We take the trailing five year growth rate and apply it to the new year. That’s it. So simple, it’s frankly simplistic. How did it perform this year? Well, the model forecasted that 774 TWh of new generation would be supplied by wind and solar in 2025 and the actual figure, already discussed, was 844 TWh. That’s a miss of about 9%— a larger miss than in years prior—but given that the model expends no effort, does no research or counting or analysis of global solar, not bad. One should also consider the rather wide error bars that the big analytical groups maintain as each year proceeds. They are doing the real work of course, the hard work, canvassing the globe for solar information—and yet that more sophisticated method has to be updated continually. Finally, revisions across global energy typically can run in the 3 % to 5% range. So a 9% error is not great, until you consider that it’s a costless forecast. What does the model say for 2026? Why, another spectacular year for wind and solar growth, of course.
Because of wind and solar’s great year in 2025, the trailing five year growth rate now lifts from a previous 16.8% to a current 17.6%. That’s great! When we apply this higher rate to last year’s level of 5525 TWh, Cold Eye Earth projects global wind and solar will advance by a huge 972 TWh this year (nearly 1000 TWh!), reaching 6497 TWh.
The project to decarbonize the world’s energy system remains a Tale of Two Cities. It is the worst of times to ponder the stubborn viability of incumbent fossil fuels and it is the best of times to marvel at the global buildout of low carbon energy. Dickens himself would surely be impressed with the clean air that now governs most world cities from London to New York. But then, someone would inevitably have to explain to him the problem of carbon build up, and the advance in global temperatures which are already affecting the world.
—Gregor Macdonald.