
Midyear Chartbook II
Monday 18 July 2022


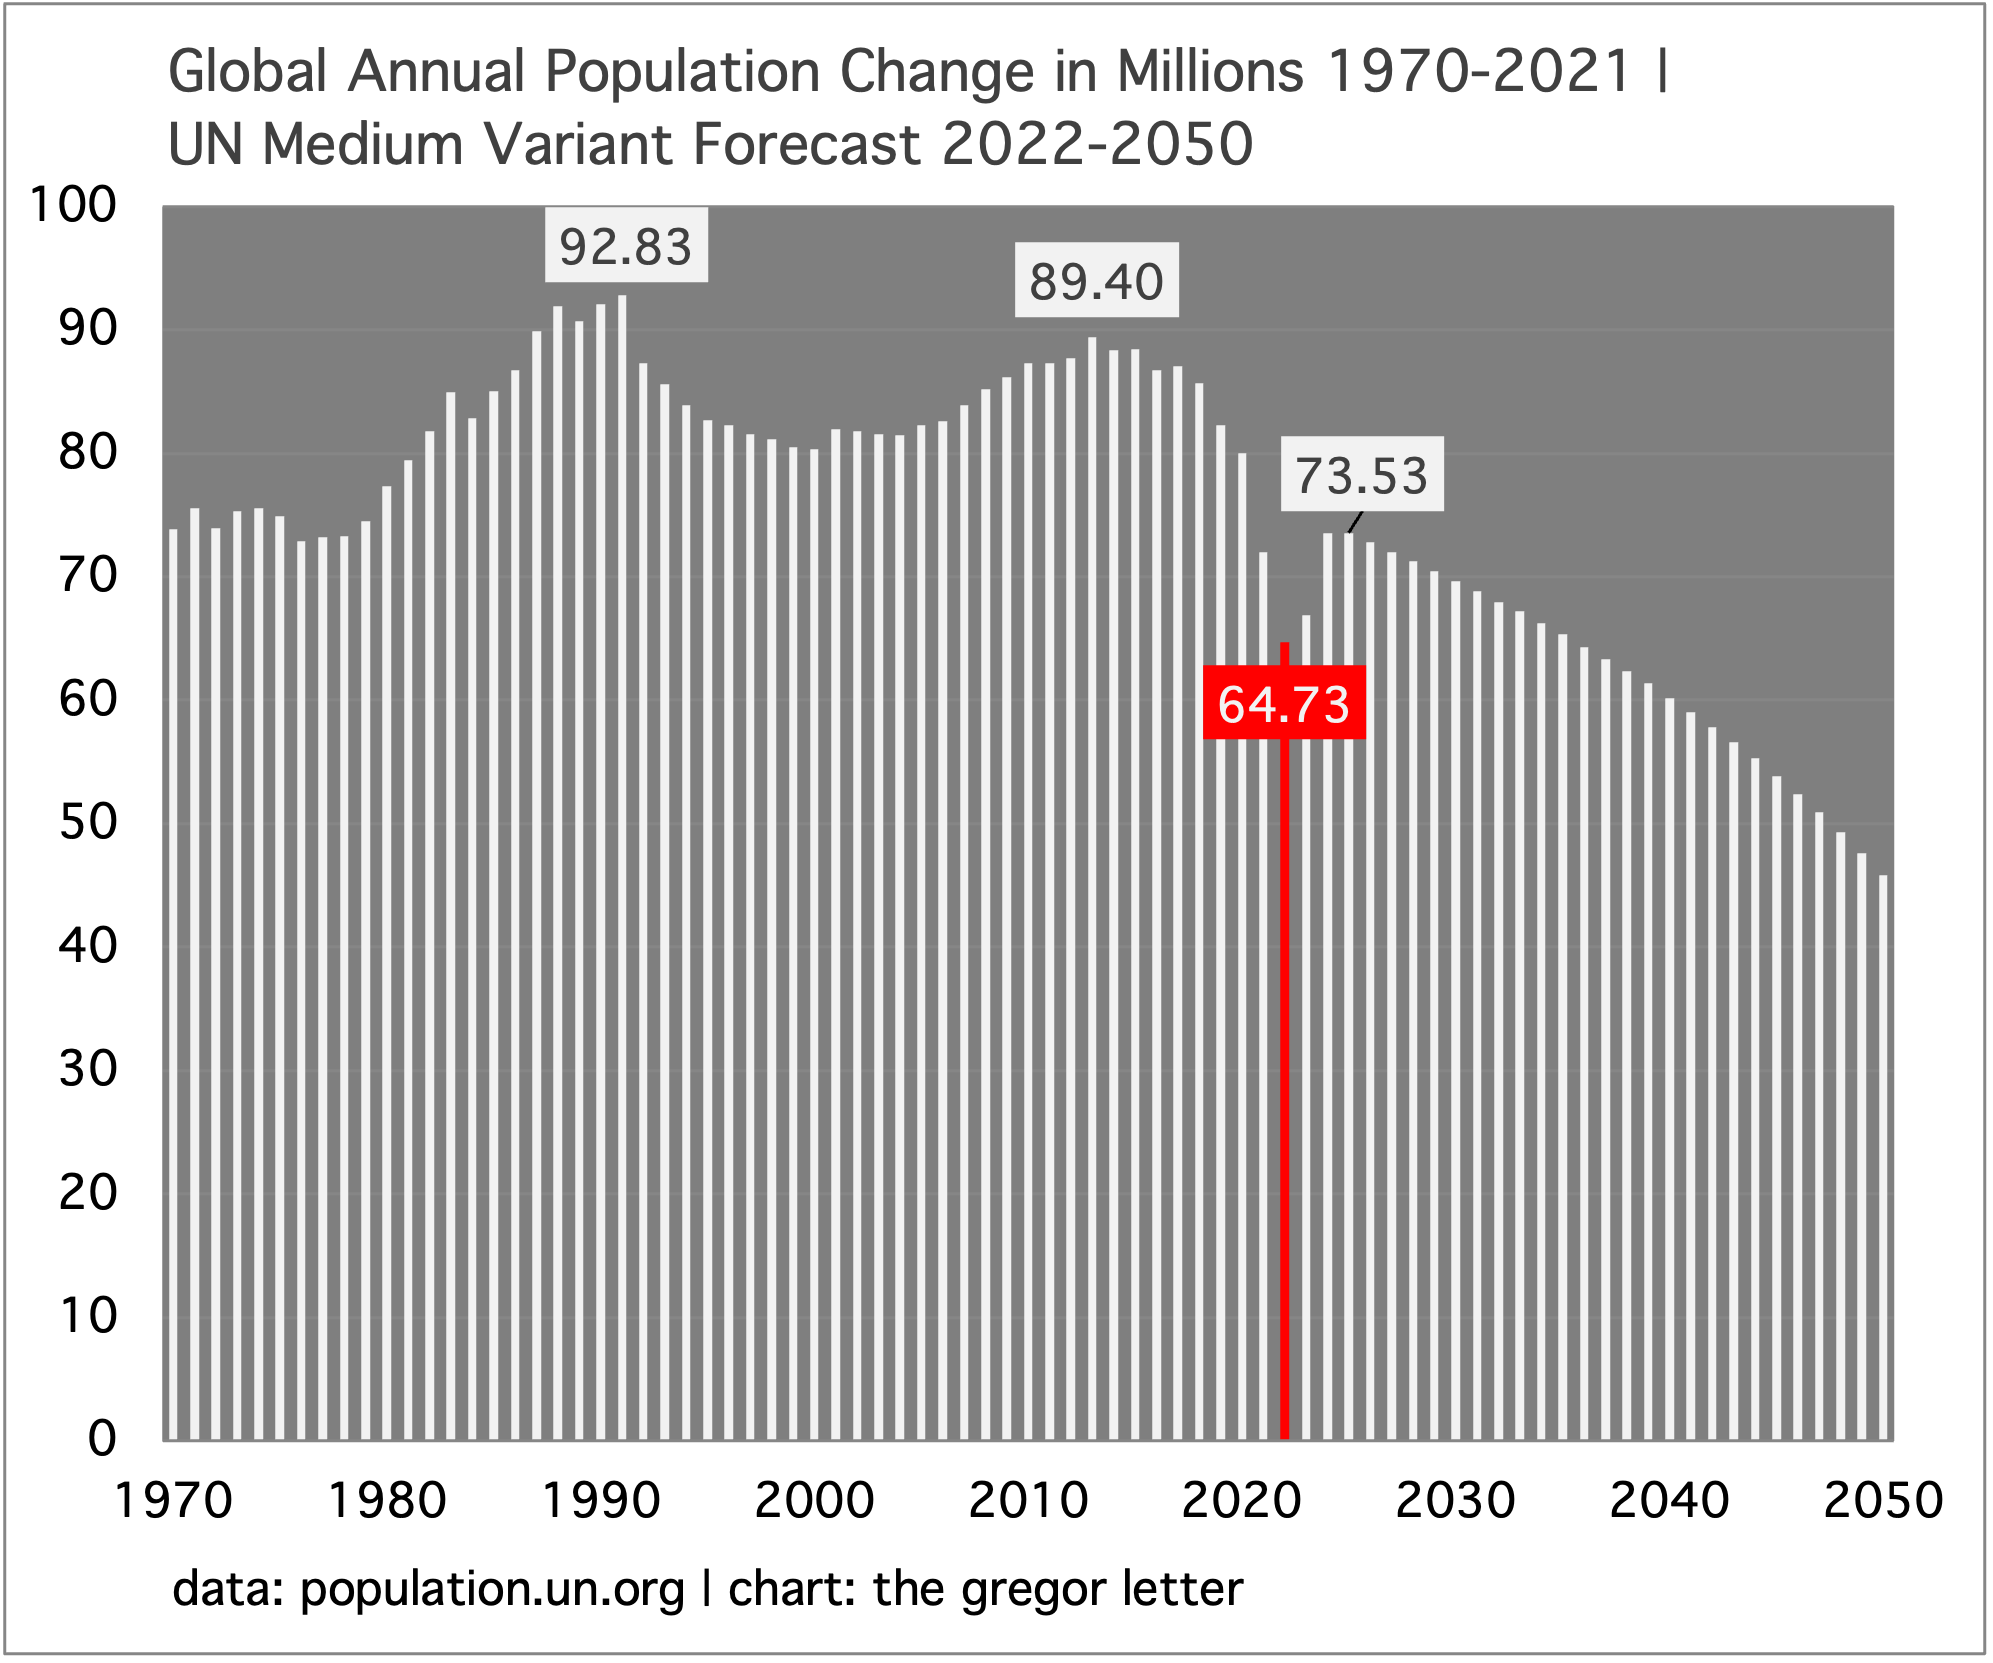
The 2020 global pandemic blew a hole in annual population growth. Starting with the last normal year of 2019, in which world population grew by 82.38 million, the pandemic kicked growth lower in 2021 to 71.96 million, and will create a very deep low this year at just 64.73 million. Next year sees a recovery to 66.89 million, and the recovery continues into a 2025 high at 73.53 million. The chart below labels the highs of the past fifty years: 92.83 million in 1991, and 89.40 million in 2013.
The pandemic however did not produce a long term decline in the rate of annual population growth. The shape of future growth you see in the chart below, going forward, has been a UN forecast for some years now. And it’s primarily due to already low rates of fertility in the OECD, now joined by the continued crash in Non-OECD fertility rates—which have been traveling downward for decades. The data comes from the just released UN World Population Prospects 2022. Note: the report itself was delayed a full year by the pandemic.
Over the years, discussion of population growth and the tax human population places on the world’s resources has often been polluted by rather hyperbolic fears about the earth’s carrying capacity. Typically, this leads to a rather pedestrian argument that population growth itself is a problem. But it’s the lack of technology, especially in health care, and the poor utilization of resources that have historically been the main driver of problems otherwise perceived as overpopulation. Humans are not in fact like deer, overrunning local food supply. Though, it can often seem that way.
There is perhaps no more important fulcrum in the evolution of population growth than the extent to which parents decide to invest either a:) a scarce amount of resources in lots of children, assuming that some of those children will die, or b:) a concentrated and adequate amount of resources in a much smaller number of children. The former configuration describes how humans have approached offspring historically, intentionally overproducing to create future labor supply, and to hedge the risk of high levels of child mortality. The latter configuration describes how humans began to behave in the modern era, as confidence in the future longevity of both parents and children expanded. That confidence expanded of course when wealth became better distributed. And it’s the primary cause for falling utility rates over the past fifty years in the Non-OECD, where countries have decisively broken with a more archaic past. But just to point out, the OECD also is still very close in time to a past when large families, indeed very large families, were the norm.
The fertility rate crash therefore will continue. An especially powerful factor in falling rates is the distribution of vaccines, and falling child mortality rates. Along with better food production, this allows adults to reframe the lives of their offspring, building in the assumption they will likely make it to adulthood themselves, and have their own children. When people first encounter these ideas, they are highly counterintuitive. Readers interested in further reading might want to review the themes associated with the Environmental Kuznets Curve, which bundles up a basket of effects that unfold when societies transition to a post-industrial phase, cleaning up their surroundings, and investing more generally in the future.

China of course is somewhat unique, in that its demographic trends were kicked off decades ago through its one-child policy. Theory, however, says that China would have seen a decline in its fertility rate regardless, just as we see in India, Indonesia, Brazil, and many other Non-OECD nations. What we might say, however, is that China’s one-child policy deepened its fertility decline. As of 2020, the estimated rate was at a seriously low 1.28, and the UN forecasts the rate dropped even further last year to 1.16. Interestingly, the UN estimates that China’s fertility rate bottoms around here, early in the present decade, and starts to rise again. That’s a projection no doubt based on the fact that the country’s one-child policy ended 7 years ago, in 2015. But it’s too late. The long term echo from the policy has altered the country’s future course. And the UN forecasts, again in the medium variant projection, China’s population to slowly deflate from 1.4295 billion this year, to 1.3169 billion in the year 2050.

Whether falling fertility rates and slower population growth is inflationary, or deflationary, is a question that animates many current economic debates. Deflationists maintain that aging populations trigger an overall decline in consumption. And, that when you combine this trend with lower fertility rates—such that younger cohorts, while still advancing, are fewer in number—that an overall deflationary effect is inevitable. Japan is often called upon to portray the details of such a view, as older populations dis-save and de-risk, often keeping their holdings in government bonds. Younger cohorts meanwhile still produce children, still have bigger needs in their 20’s and 30’s, but are not able to offset the effects from the growing bulge of retired workers. Finally, these upside-down demographics aggravate the age-dependency ratio: the struggle to support an expanding non-working population by an ever smaller, working population. Functionally, this tends to lead to policies that favor older citizens, and in Japan, one could argue that its long deflationary period was a time of constant fiscal spending, or if you like, money-printing to protect its vast population of old persons. The argument overall is further strengthened by the fact that both Europe and the US have also entered a prolonged, disinflationary period as their populations too started to age-out. Both regions also have low fertility, which produces alot of agreement that the US especially needs higher levels of immigration if it’s not going to achieve higher rates of birth.
The inflationary view concentrates on the lack of workers. Perhaps the pandemic gave us a preview of this line of thinking. Demand recovered quickly via emergency fiscal and other safety-net policies, while the ability of the world to maintain output came under chronic strain. And we are still suffering from that lack of output today, in the form of shortages and inflation. For a recent discussion of this view, see this Vox.eu article by Olli Rhen, governor of the Bank of Finland. Central to the view is that workers—on whom the retired population depend—will be able to command higher wages. And it should be noted, post pandemic eras historically turn out to have been periods when labor finally gained the upper hand, in the wake of reduced populations.
While The Gregor Letter is intrigued with this newer, counterintuitive inflationary view of an aging world, evidence is going to have to start accumulating in order to beat back the conclusions we can draw already by the actual, lived experience in the OECD. One fact that persistently counters the inflationary view is technology. Even if one argues that globalization increased the rate at which we brought low income workers into the global economy, where they then transitioned to become higher income workers, it is equally the case that wage pressures drive automation. When Marc Andreessen quipped that software was eating the world, just replace “world” with “workers.” The relentless advance of software and automation previews how global business will grapple in the future with wage pressures should they persist. Overall, the inflationary view of an aging world ultimately needs a slowdown in tech and efficiency gains. Given that the world is currently transitioning to far more efficient energy—as one, very big example—it frankly seems like a tough case to make that the overall effect of slower growing populations will be inflationary. And by the way, the UN is projecting that world population still grows from today’s 7.941 billion to 9.687 billion in 2050 (medium variant).
The amount of energy required to run transportation on electricity is so much less than in the legacy combustion system, that it’s a surprise this fact is still not yet well known. Wrongheaded intuitions about the energy demands of electric vehicles are the norm in media, and a recent check-in on the American financial channel CNBC saw hosts talking about this issue at the level of uninformed high-schoolers. It’s also the number one question The Gregor Letter has to field from the mailbag. Seriously, if you are university educated it’s not much of a challenge to educate yourself on these facts. Here is a common intuition, for example, that just couldn’t be more wrong: “Bob thinks that for every million barrels of oil energy we save by moving a tranche of ICE cars off the road, to be subsequently replaced by EV, means we need to shovel in that same quantity of energy into the powergrid.” Oof. The internal combustion energy wastes at least 60% if not 70% of its energy to waste heat. Not so the electric motor. Accordingly, you could run the United Kingdom’s EV fleet entirely on coal-fired power generation, and still harvest massive energy savings. Good news. This counters the other very common, but wrong and bad intuition: “What’s the use of EV, when they’re just going to run on coal?” Not just wrong, but wrong on two levels. As mentioned, we could run new EV on coal fired power. But we’re not going to! Powergrids globally are being cleaned up rapidly through a combination of natural gas, and wind+solar. Coal has crashed so hard in the US, it went from providing 50% of our power in 2008 to just 21.8% last year. And it’s going to fall further.
Using the most recent data from the BP Statistical Review, we see that in the world’s largest market for EV sales, China, the annual growth of new power generation continues to far, far outpace new demand from on-road EV.
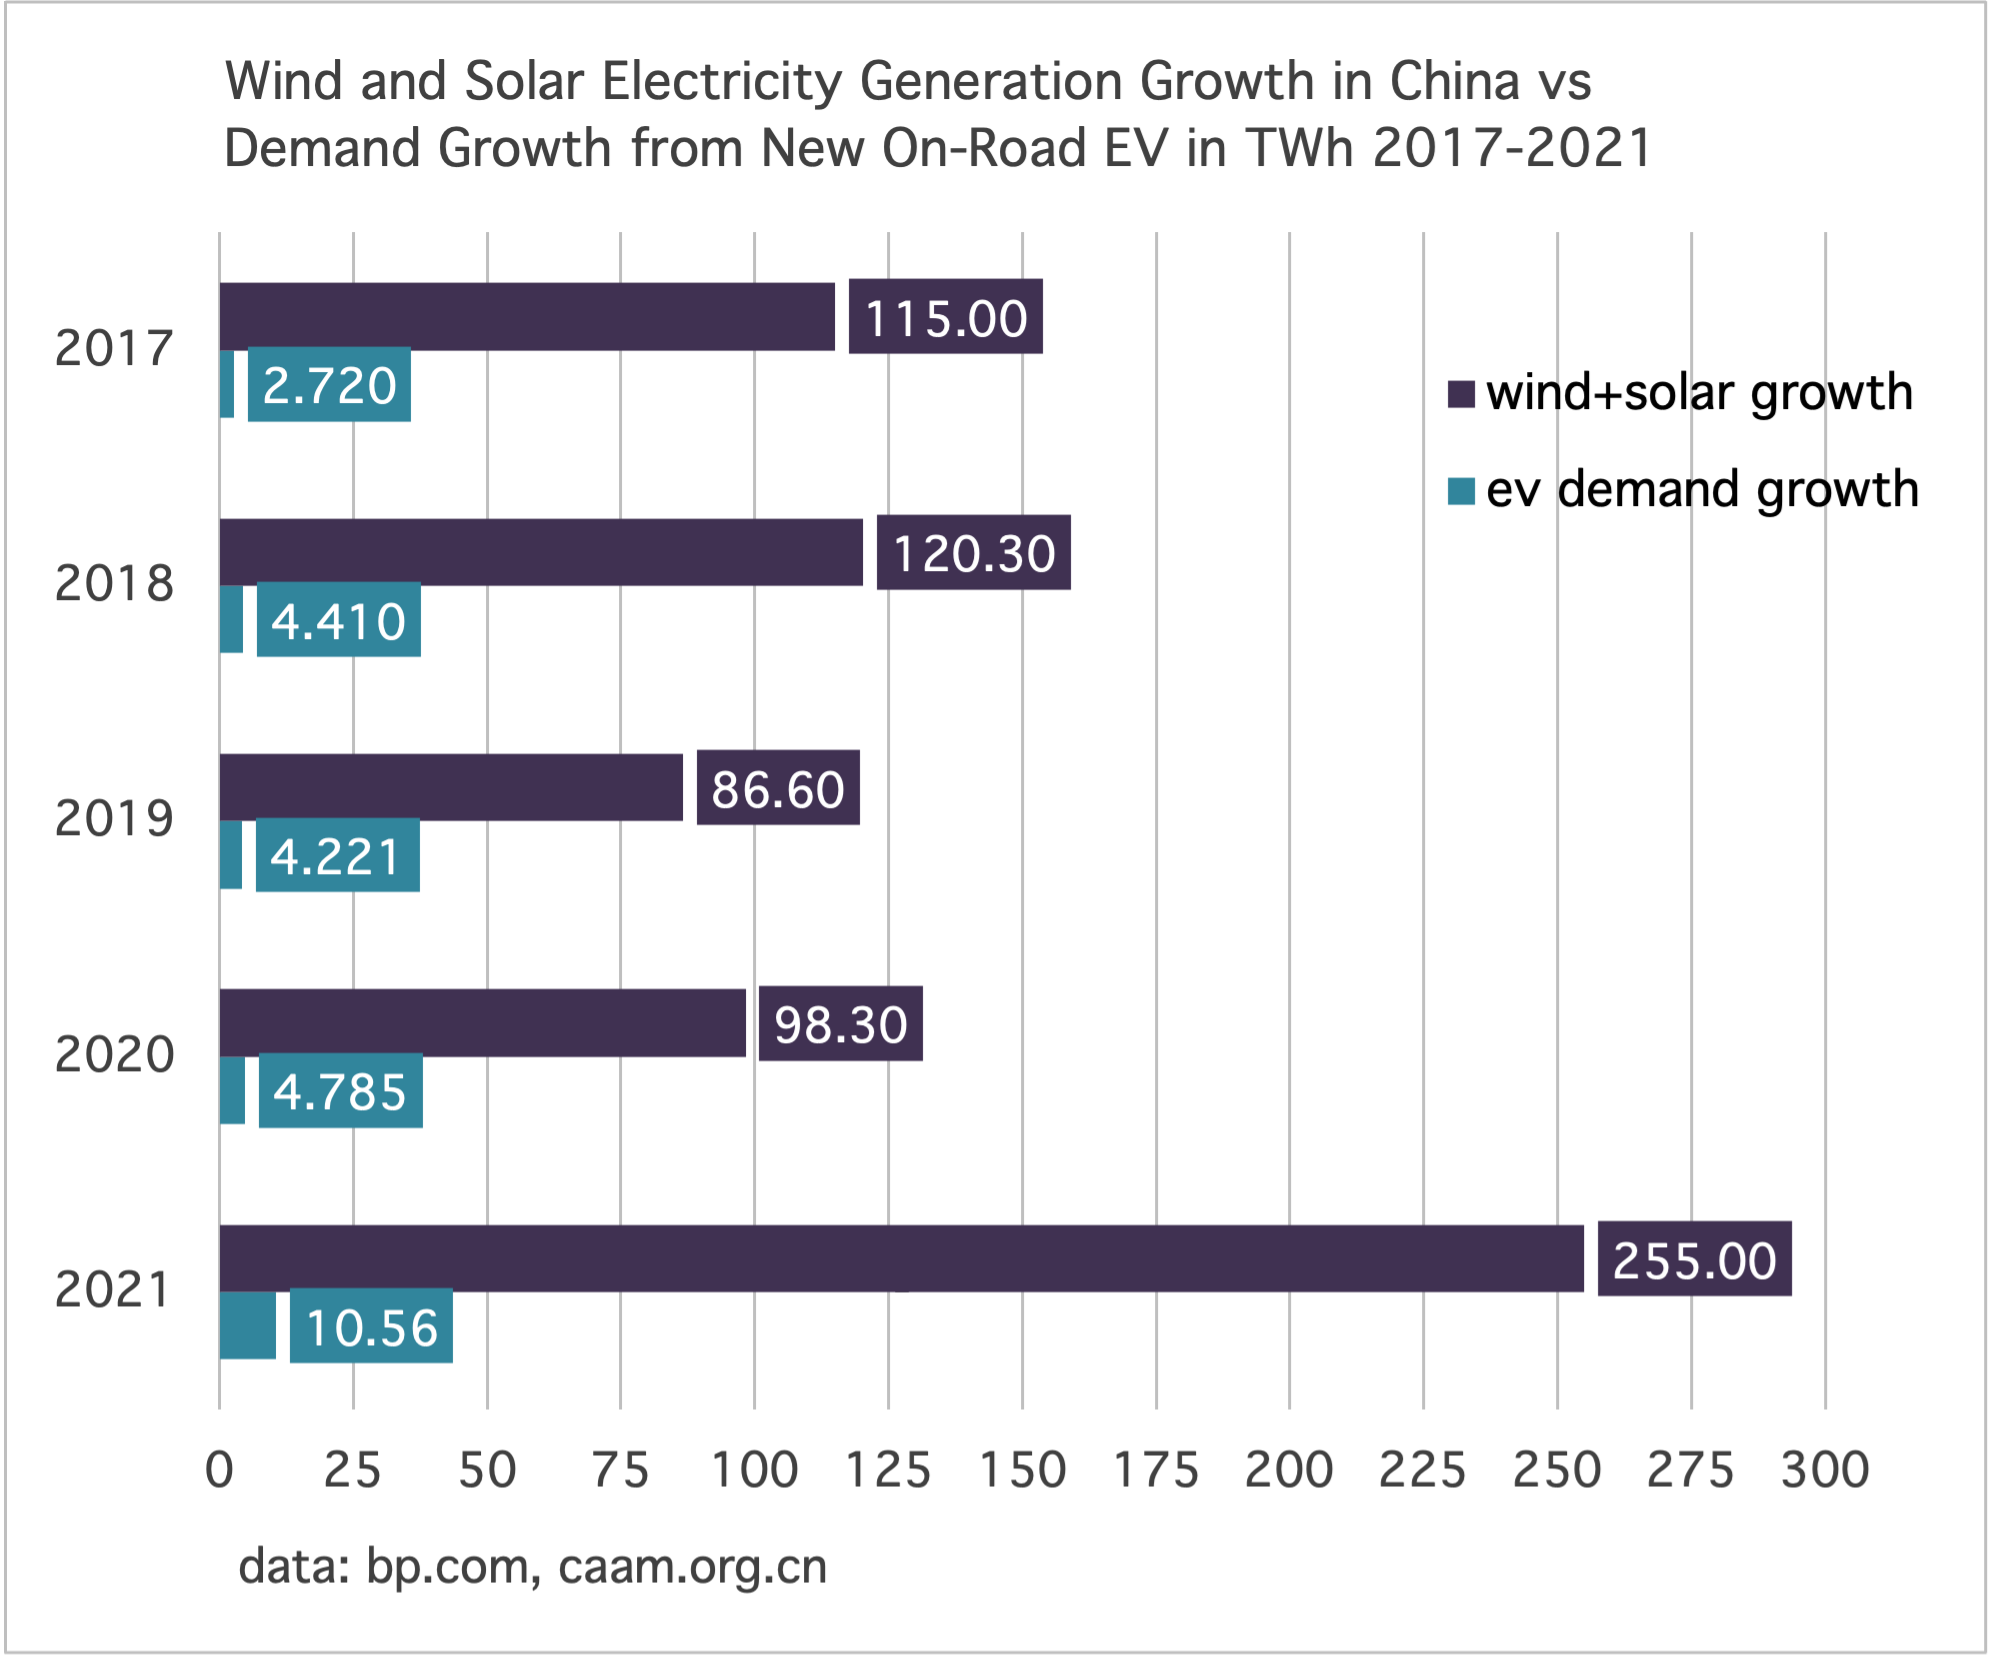
Just to be clear, this chart shows that annual growth of generation from new wind and solar in terawatt hours—not the capacity, not the aggregate generation—totally overwhelms annual terawatt demand growth from new on-road EV. In 2017, China put 777 thousand new EV on the road, representing 2.72 TWh of new demand on the powergrid. But in that same year China created 115 TWh of new electricity generation just from wind and solar. In the most recent year for data, 2021, new wind+solar generation was 25X new demand from on-road EV: 255 TWh vs 10.56 TWh.
Data note: China EV are estimated at 3000 kWh of demand per vehicle per year. For comparison: US EV are estimated at 4000 kWh per vehicle per year. These are reasonable and standard demand figures for EV in each country. But let’s say you wanted to be ultra conservative, and assign 3500 kWh of annual demand for each new on-road EV in China. Hardly makes a difference. In that case, the 3.521 million new EV that hit the road in 2021 would have demanded 12.32 TWh of extra power, instead of 10.56.
Let’s make a hierarchy of transportation efficiency, as we move from a system running entirely on petrol to a system running entirely on electricity, from clean sources like hydro, nuclear, wind and solar.
Internal combustion engine vehicles running on oil → electric vehicles running entirely on coal fired power generation → electric vehicles running entirely on natural gas fired power generation → electric vehicles running on a typical grid mix of coal, natural gas, hydro, nuclear, wind and solar → electric vehicles running entirely on clean sources like hydro, nuclear, wind and solar.
Where does the biggest energy efficiency gain occur? Right in that very first step, going from ICE vehicles to EV. As the Department of Energy points out:
EVs convert over 77% of the electrical energy from the grid to power at the wheels. Conventional gasoline vehicles only convert about 12%–30% of the energy stored in gasoline to power at the wheels.
Systems closest to the optimal end-state of EV running entirely on clean sources can be found in California, and the United Kingdom. As your grid is cleaned up, it too becomes more efficient, offering an extra kicker to the systemic effect of running EV vs ICE. NREL, another division of the DOE, is already estimating the size of this kicker, and The Gregor Letter has been over this terrain several times already. But simply put, a Tesla driven one mile in Columbus, Ohio is every bit as energy efficient as that same Tesla driven one mile in San Diego—on the level of motor efficiency, at the level of the engine itself. But once you add California’s grid level penetration of wind and solar you get another 20-25% of systemic efficiency because not only are you avoiding waste heat at the level of the engine, but at the power plant itself.
Golden rule: combustion may be powerful, but it’s wildly inefficient.
Let’s bring this entire discussion down to a simple proposition. The US continues to consume about 9 million barrels a day of gasoline. That gasoline has a heat content which you can measure in BTU or joules. A conservative estimate for how much energy the US transportation system would save in a full ICE to EV transition, therefore, is about 50% of its current road fuel budget. By turning its back on all 9 million barrels a day of gasoline, and running EV instead on clean sources, the US would harvest a systemic savings of energy equal to about 4.5 million barrels a day of gasoline. And that’s a conservative estimate. This math is not that much harder than the math homeowners used during 20th century energy crises to estimate savings on home heating costs by investing in “expensive” super insulation, and other building standard upgrades.
Natural gas continues to establish path dependency, and will be increasingly hard to dislodge from the world’s energy system. The current energy crisis in Europe is a reminder of how embedded natural gas is already in industrial and heating systems. While current progress on hydrogen applications is encouraging, we remain a very long distance from adoption at scale. Mostly, if you want to see growth blunted in global natural gas adoption, you will need to see even higher rates of WSS growth (wind, solar, storage).
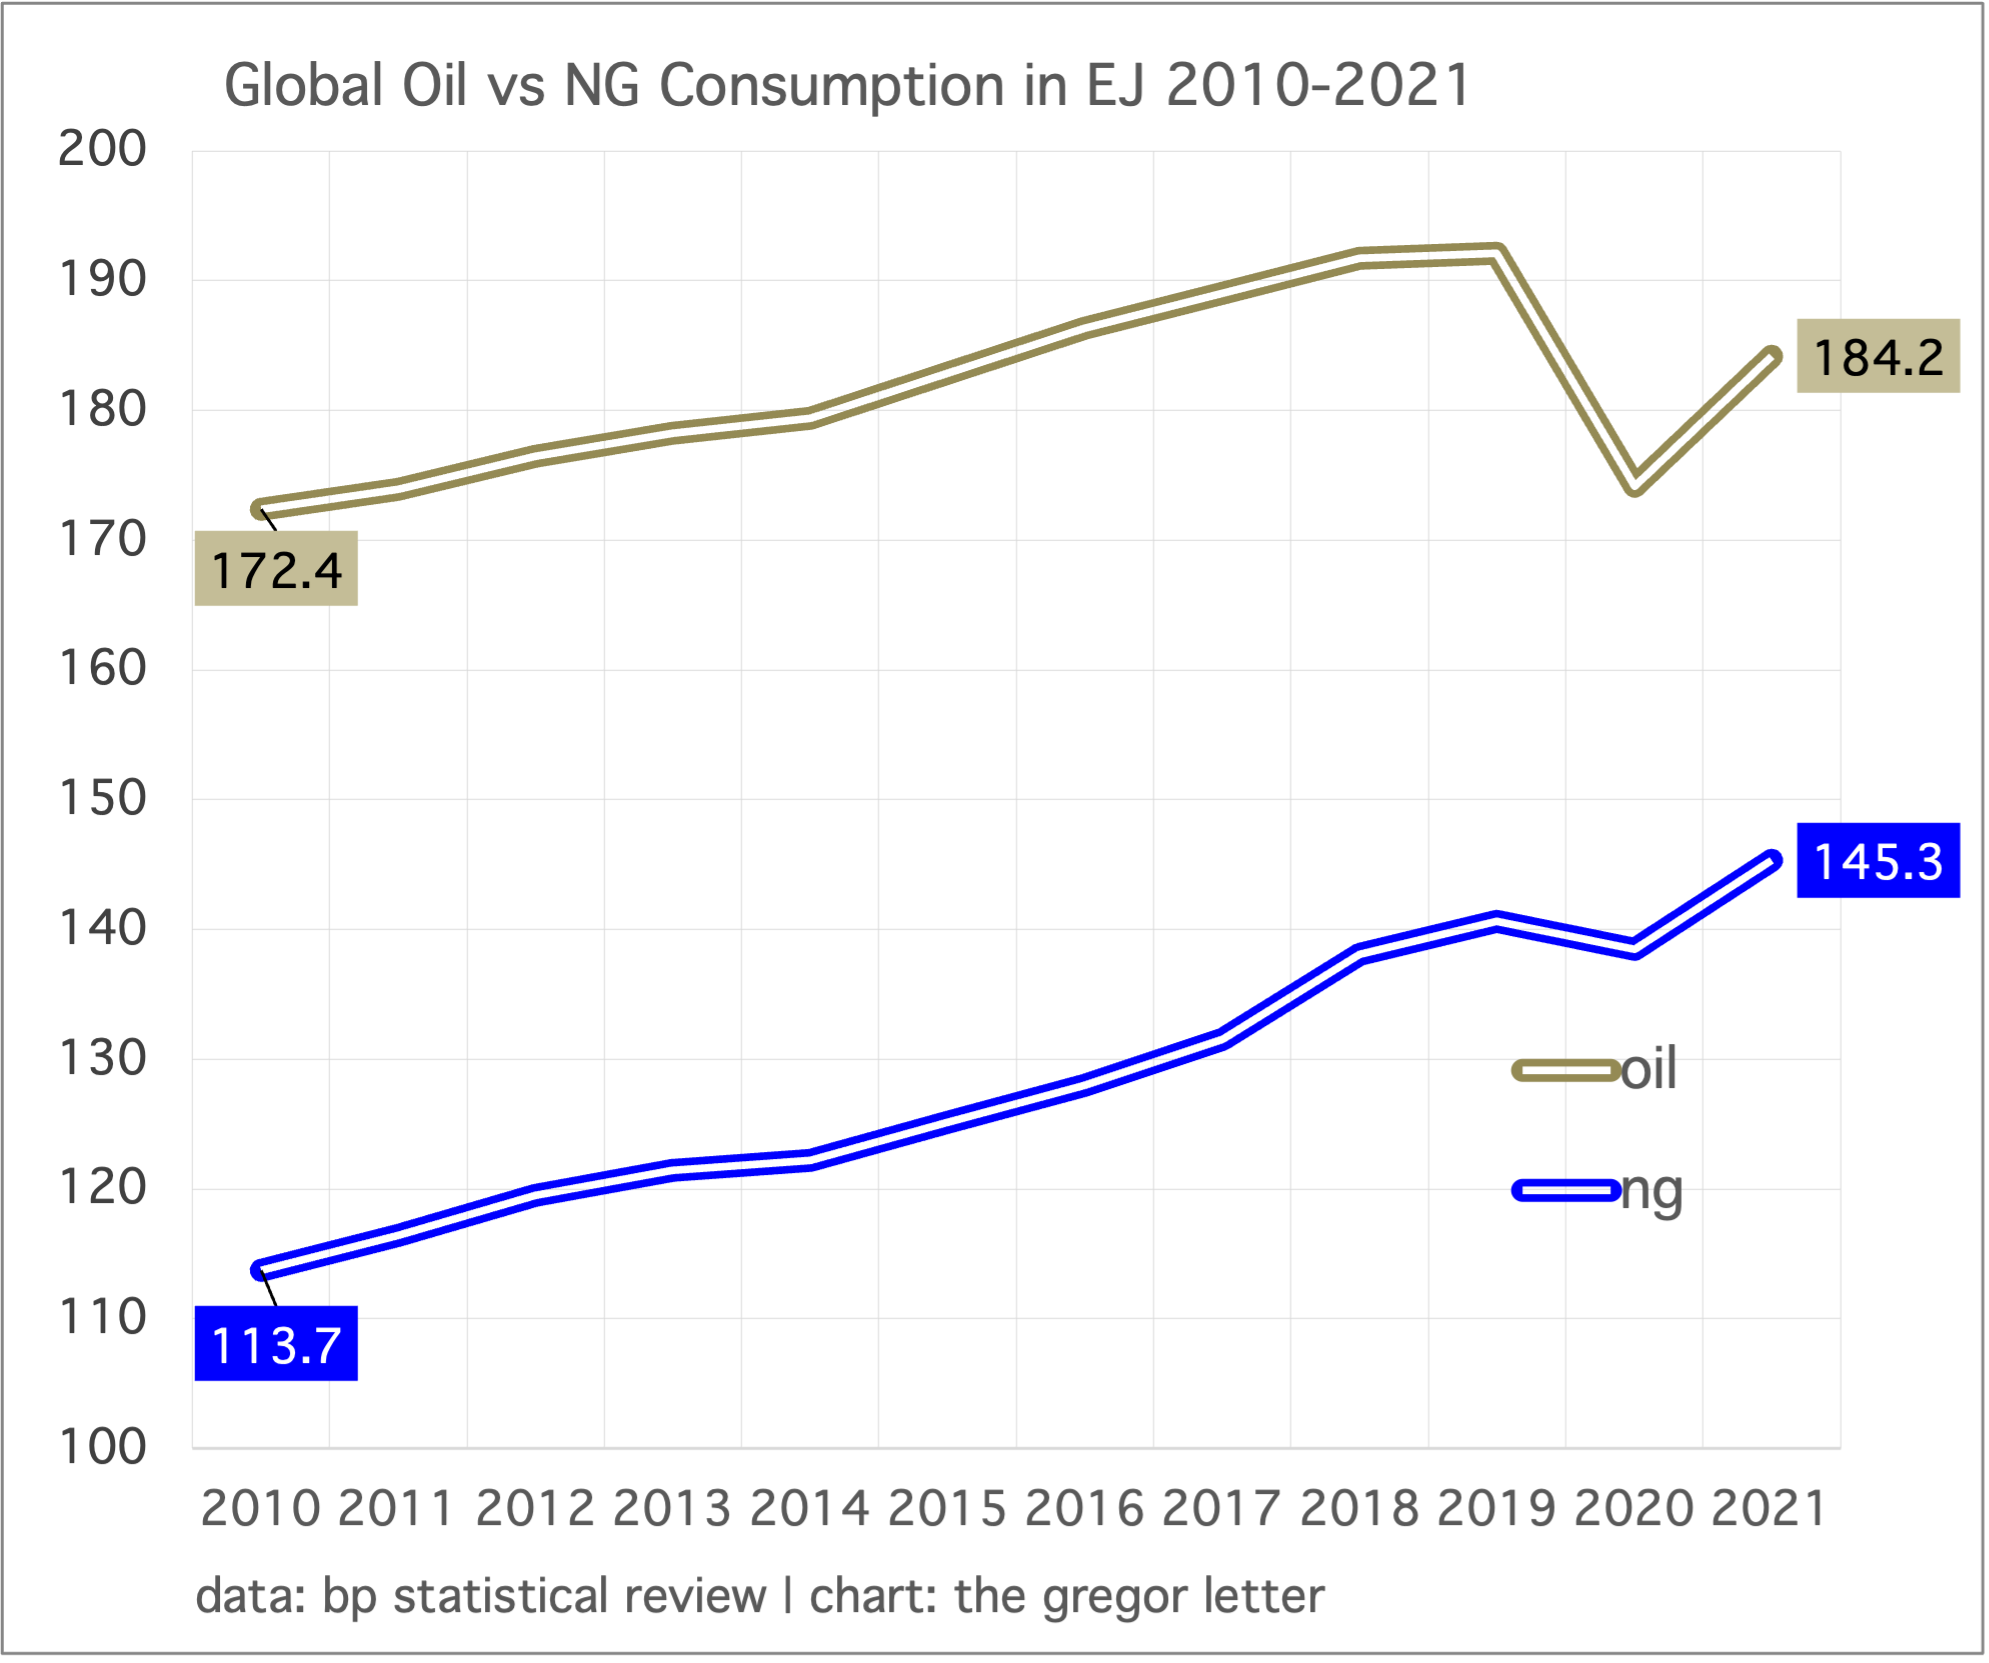
The chart here shows that while global oil demand has advanced by 6.8% since 2010, natural gas demand has grown by 27.8%. That is a profound differential, and underscores that decarbonizing transportation is the far easier task, compared to the heat requirements needed in so much power, industrial, and built environment systems. Notice also how little natural gas demand was affected by the pandemic, and how strongly it rebounded in 2021. If you accept the proposition that global oil demand has entered a plateau (lasting say another 3-7 years before finally entering decline) then global natural gas adoption at its current rate will reach oil’s current consumption level in about ten years. Who or what will stop natural gas is this decade’s question.
Coal in global power generation has fallen from a 40.7% share in 2011, to a 36.0% share in 2021. That may not seem like a dramatic decline. But consider that the primary driver for global coal consumption, China, has seen coal in its own power generation advance by a sobering 81% in the same period. Outside of China, therefore, coal has crashed. Just to make sure readers understand the category addressed here, this chart does not include the consumption of any energy source outside the power sector, like natural gas and coal—two sources used heavily to create heat in industrial applications like steelmaking. Energy transition looks great at the level of powergrids and transportation, but faces its most serious challenge in all sectors where fossil fuels continue to be the primary source for making heat. Data source: BP Statistical Review.

The powergrid is the future energy platform of humanity. We will steadily move transportation, the heating of homes and buildings, and the production of hydrogen over to the grid. The Gregor Letter likes to track therefore the annual growth rate of oil consumption against the growth rate of electricity generation, to portray how these two worlds will continue to diverge, with power generation eventually winning out. Last year, the world generated 28,466 TWh of power, rebounding by 5.87% from the slump in 2020. But notice that global power generation barely fell in the pandemic year, unlike oil which suffered its biggest single year decline ever, over 9.0%. And over the past decade, oil growth has only exceeded grid growth in one year, 2015. Let’s trot out an idea that’s been offered for many years now, over various newsletters and reporting: the next unit of global GDP is far likelier to be built now on the back of the grid, rather than through oil. Oil is no longer the platform for growth.

—Gregor Macdonald