
Next Steps
Monday 4 August 2025


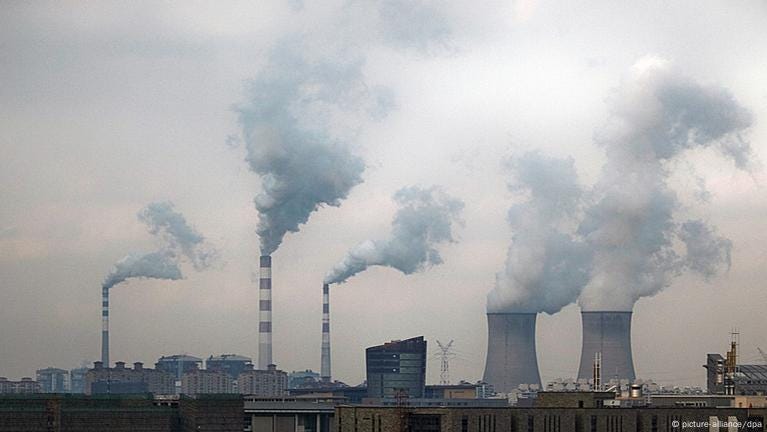
Decarbonization of global power faces a robust headwall of incumbent generation capacity that’s fated to erode, but only at an exceedingly slow rate. What to do? The standoff between this formidable headwall and wind, solar, and batteries is not challenging to explain using the intrinsic qualities unique to both categories. Wind, solar, and batteries are still too costly in nominal terms to wreck the economics of the incumbent fleet, while that same fleet, by contrast, enjoys path dependency and the ability to deliver the marginal unit of power at competitive cost. Let’s review our current location:
I
• Even in nominal terms—even without the consideration of externalities like air pollution and climate change—wind, solar, and batteries reign supreme now in the market for new generation. Unless you are going to introduce Soviet-style policies that protect coal and natural gas, every region of the world is now tipping toward wind and solar in the new build of power. There are some lagging effects here, of course, and parts of the world continue to add new natural gas capacity to replace some of the old, but the rate of these additions has slowed greatly. The free market has spoken here, and there is no turning back.
• Wind, solar, and batteries are also successfully agitating the incumbent fleet at the margin, where the economics of incumbent capacity are still favorable, but barely so, already weakened to a point of vulnerability. You can see this in myriad examples of old, weakly viable coal and natural gas as the onset of renewables starts to depress wholesale power prices—and as a result their economics, already close to the tipping point, succumb to reality. Just to note: this has been observed in old nuclear and old hydropower too. Wind, solar, and batteries absolutely disrupt powergrid pricing in their own favor.
• The difference between a new technology being cheap and cheaper than, however is non-trivial. And here we get to a rather persistent blind spot that plagues the climate community, one that at this point can only be regarded as outright denial. Wind, solar, and batteries are cheap. They are the fastest and most cost effective way to bring on new power generation. However they are not cheaper than the great mass of incumbent capacity. If they were, they would revolutionize the landscape at a much faster pace. Wind, solar, and batteries are unlike many technologically advanced consumer goods that have rolled out over the past century, for example, that have offered so much value, at such competitive prices, that they allow consumers to simply throw away their incumbent products.
II
The political economies of the West are therefore uniquely disadvantaged in the effort to attack this headwall of incumbent generation because of the privilege these societies grant to private property. Within Western economies, however, Europe has admirably made inroads on this issue as it has been moderately successful in (1) bringing the cost of fossil fuel externalities into the policy mix, which of course reveals the truth that fossil fuel generation has a cost to society that far exceeds its nominal costs to operate. And now there are indications Europe may also be (2) starting to overbuild wind and solar (not an easy thing to do, or sustain, in a world of private property, shareholders, and credit markets). Overbuilding would indeed be a clever and rather delightful way of bullying fossil fuel power capacity into fuller submission—if you can actually pull it off.
For the West, therefore, Europe is once again demonstrating that social democracy is probably the optimal political economy, and the Union has applied these same principles and strategies to healthcare, public transit, and the wider array of social services. Another term that describes this approach is the “free market welfare state.” While the U.S. also has a version of this political economy, it shares with the British Commonwealth countries (UK, Canada, Australia, New Zealand) just enough unease with the “social” component of this system that we don’t quite get the full or stable continental version in the English-speaking world. The Commonwealth countries, to be fair, are of course more advanced in this regard than the U.S.
Did Europe overbuild wind and solar capacity, as recently as last year? The data indicates this may be the case, at least directionally. According to the 2025 release of the EI Statistical Review (the benchmark provider of global energy data, along with the IEA), the EU grew wind and solar generation by 60.5 TWh as net demand growth from all sources came in at just 53.1 TWh. How intriguing! Let’s look at the composition of that annual change.
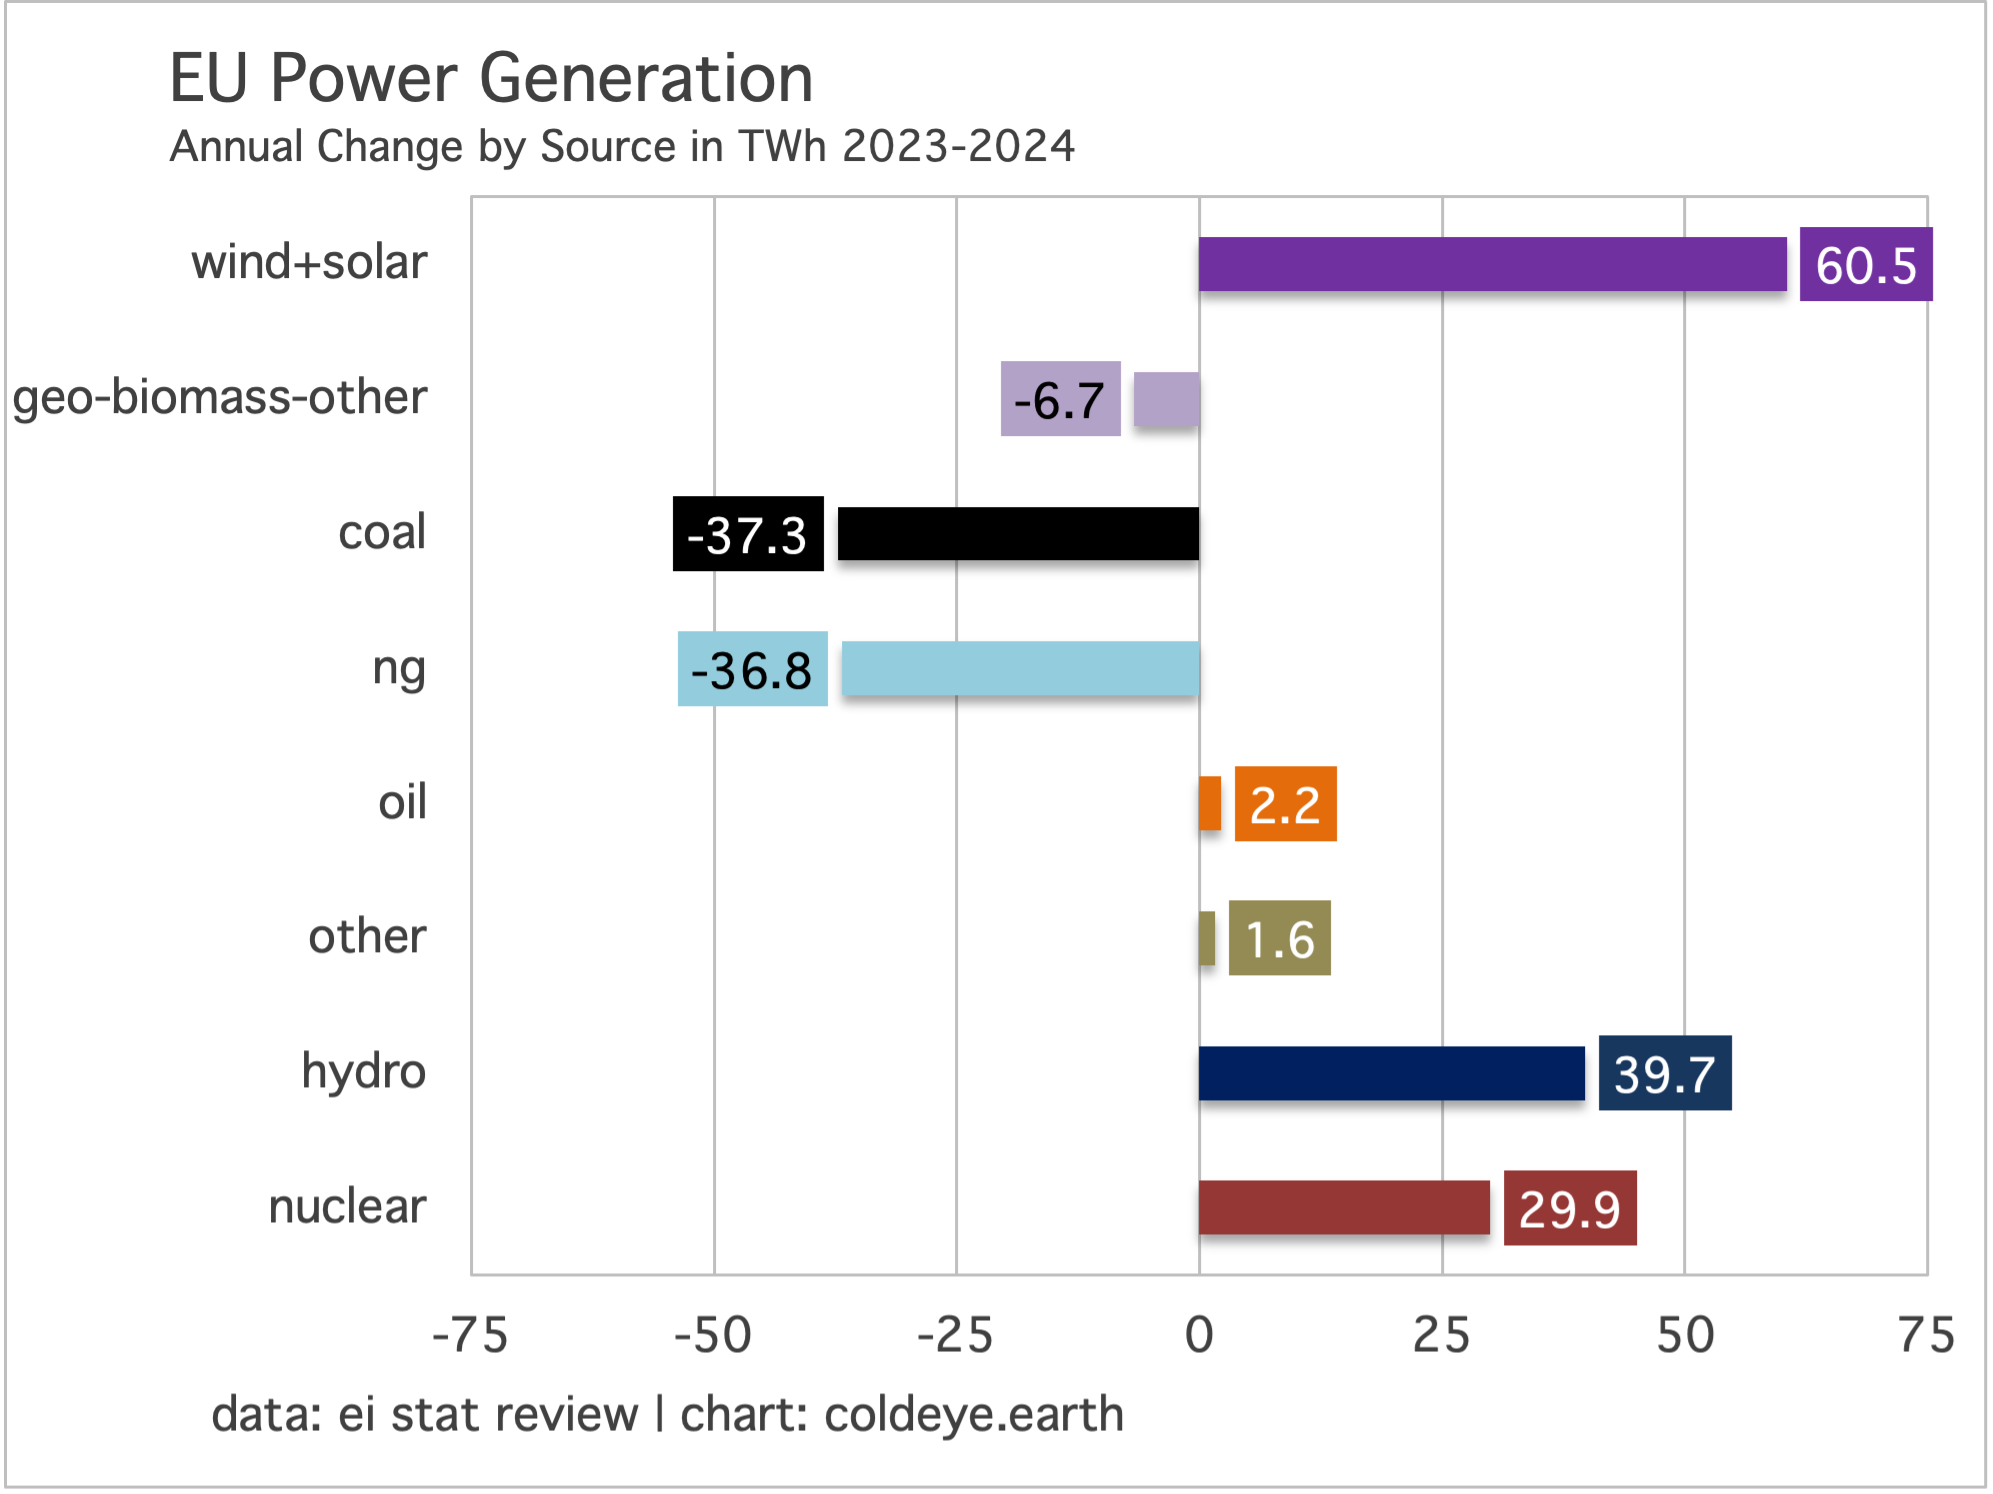
If you sum each of the totals in the chart, the product will be 53.1 TWh. That’s the net advance of generation from all sources. And yet, that total is lower than the annual increase in wind and solar alone, of 60.5 TWh. While it’s too early to say whether the EU can repeat such a performance in the years ahead, it’s worth considering a small signal is starting to flash here that even when the EU power system is gaining hydro and nuclear output—and losing coal, natural gas, and geothermal/biomass output—it has roared ahead regardless with enough wind and solar to overwhelm the system with bountiful, new clean energy.
III
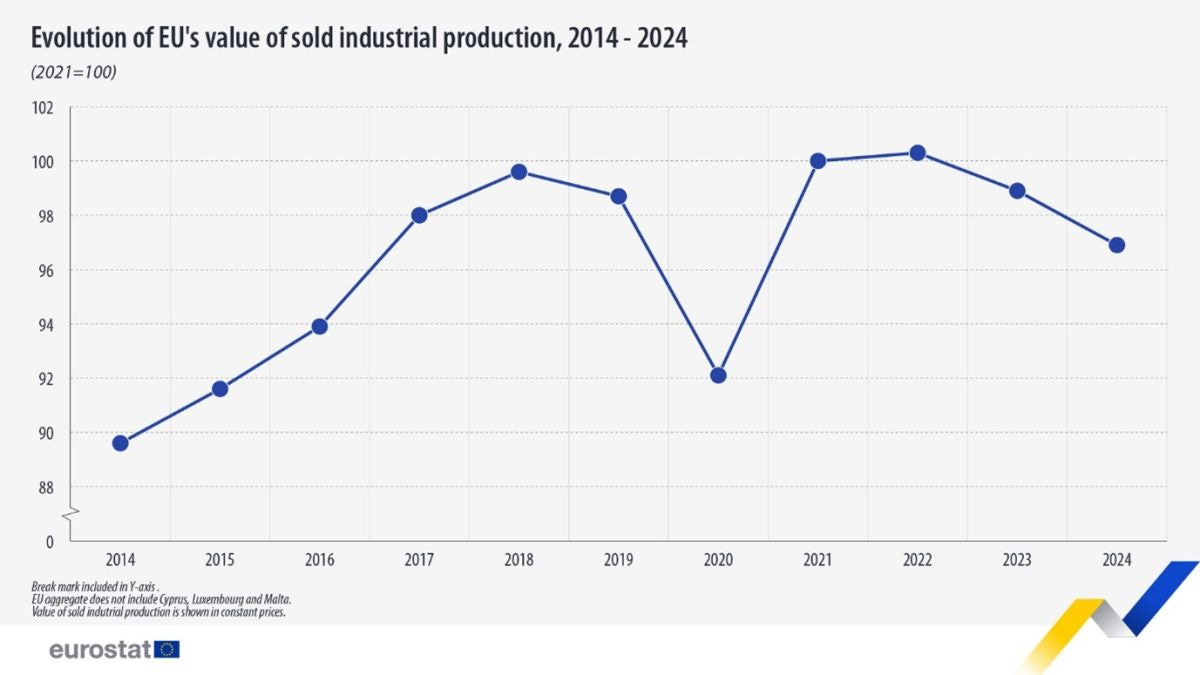
Unfortunately, there is an underlying trend starting to form in Europe’s economy that deflates, or at least colors, the hope for a new era of decarbonization—and that is the rather pronounced and sustained decline in the EU’s manufacturing output. Here we run into an old and familiar problem: deindustrialization on an incremental basis in the West has largely wound up as increased industrial activity in Asia. We want to be careful here with the word deindustrialization, because it implies a gargantuan trend that’s the result of failed policies. Here it’s more of a steady erosion of the EU’s industrial output that’s playing out, and it would be unwise to forecast whether it continues. Needless to say, two of the most important variables that come into play when gauging decarbonization are the overall economic growth rate and the composition of the economy itself, whether it leans toward services and consumption or industrial output and manufacturing. When we look at the latest data on EU output, it’s effortless to imagine how this trend is making decarbonization a whole lot easier. From the July 2025 Eurostat release:
…The EU’s production of manufactured goods decreased by -2.0% in 2024 compared with 2023 and in the previous year, it decreased by -1.4% compared with 2022.
The recent decrease was recorded in 15 industrial activities with the biggest decrease in the manufacturing of motor vehicles, trailers and semi-trailers, followed by manufacturing of machinery and equipment n.e.c, the manufacturing of electrical equipment and the manufacturing of fabricated metal products, except machinery and equipment.
Just to remind, while China has secured its position as a global leader in the output of solar panels, heat pumps, electrolyzers, and wind blades, it is Europe that largely supplies the highly engineered electrical components and equipment that anchors powergrids globally, and China did indeed uptake a ton of that cutting-edge technology by purchasing it outright from the U.S., and especially Europe, over the past 20 years. So it’s a concern for the EU economy, unfortunately, to see that sector highlighted as one of the main decliners. Again we face the interplay between economic growth and decarbonization, and how economies place extreme pressure on the decarb effort during strong growth, while alternately offering great relief when they contract.
To conclude, Western economies are built on legal foundations that make revolutionary change hard to realize, in contrast to command economies like China, which are almost totally unconstrained in forcing investment losses onto certain sectors. China is clearly overbuilding wind and solar, just as they originally overbuilt coal-fired power capacity, and such overbuilding comes at a cost to the state and no doubt results in at least a partial loss of wealth among owners of legacy generation. The West has to be more patient and delicate to achieve such outcomes, and we do this through tax incentives, pollution pricing, and regulatory changes. Each of these is designed to gingerly tread the fine line between private ownership of assets and the state’s ability to conduct takings. Here’s an example of that borderline: in most municipalities in the U.S., if the town or city wants to build sidewalks, they likely already have the power and the right to take about five feet off your front lawn, without any compensation to you at all. If, however, the state needs to bulldoze 10 houses in your neighborhood to build an extension of local commuter rail, well, yes, you will be compensated. Welcome to the West, where it is harder to get things done quickly in the physical world because democracy and private property generate lengthy, deliberative processes.
Global fossil fuel consumption increased by 1.3% last year, a reminder that the additive model of energy transition is mainly a result of economic growth itself, and less so the energy sources involved. From a climate perspective, we are one world, everywhere, and at all times. If industrial production is rising in China, that’s the world’s industrial production rising. If wind and solar deployment is going gangbusters in Europe, that too is not a regional phenomenon but a global one. China maintains a massive industrial base to serve the world. California does not maintain a massive industrial base, is a service and knowledge economy, and is decarbonizing nicely because it’s transformed itself into a lovely 21st century-island that generates industrial production too—just not within its borders. There is no escape from this single-world reality.
Just to make this plain: if your country is not going to produce cement and steel, then some other country will wind up doing so. Same with oil, copper, cars, ships, and lumber. The 1.3% growth in aggregate fossil fuel consumption last year is exactly the kind of growth rate that, despite even the most heroic buildout of renewables, is enough to keep oil, coal, and natural gas viable and forecloses on the prospects of actual consumption declines. That’s how the additive model of transition is formed, and why it has accurately described all previous energy transitions.

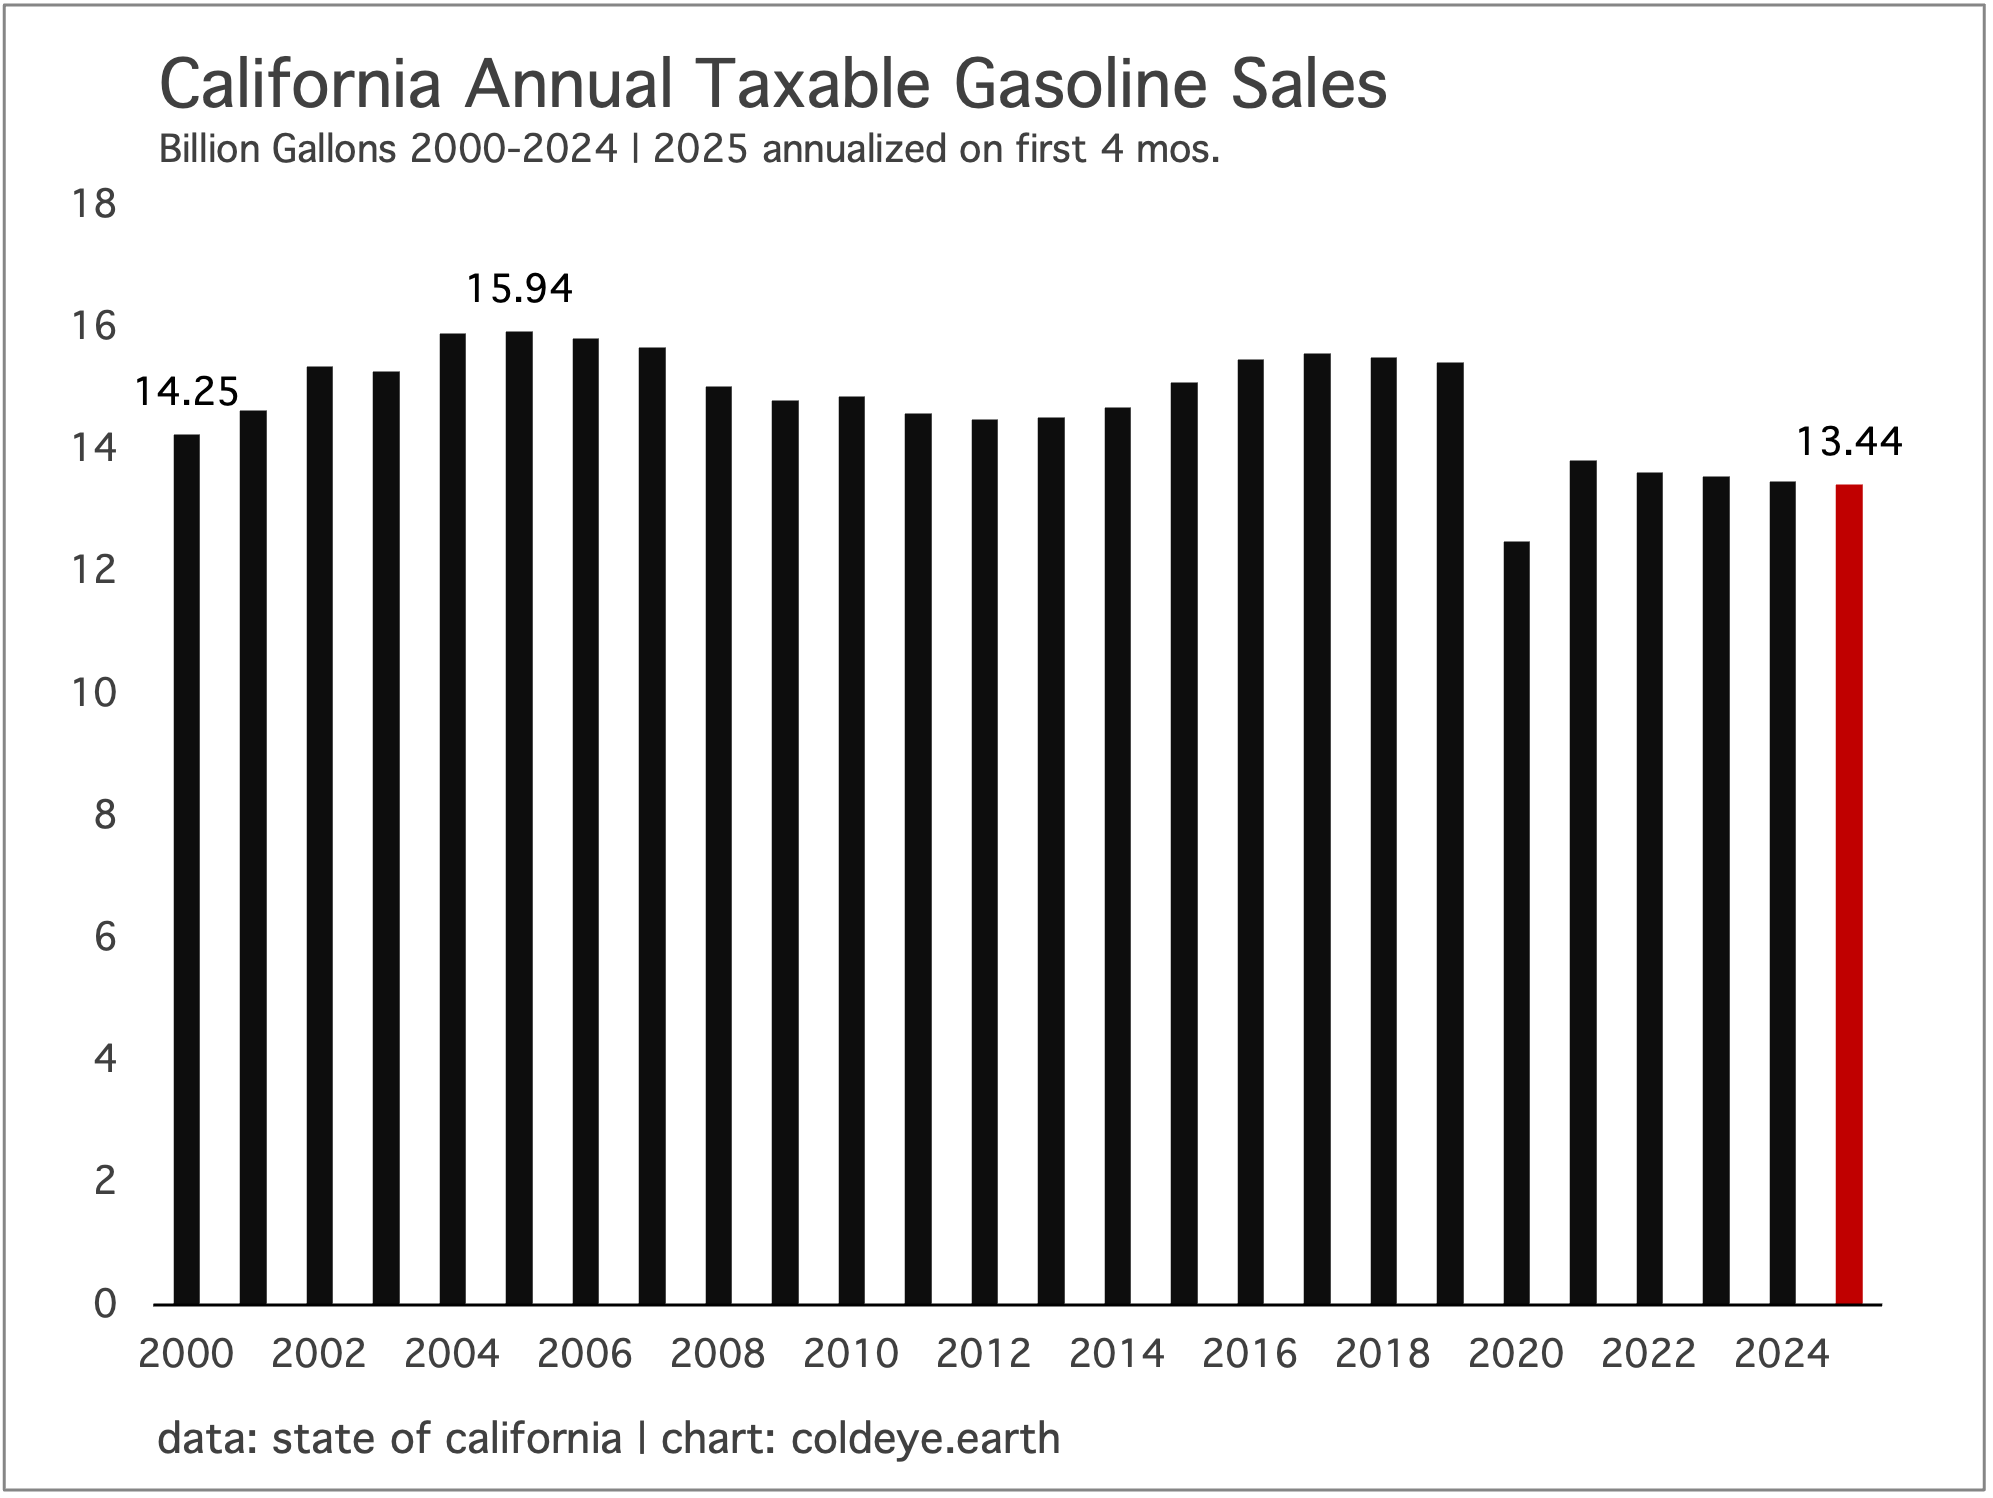
The century-long experience of gasoline consumption in California is potentially a useful model for how, after great effort, we can halt the growth of at least one category of fossil fuels: petroleum in transportation. Higher gasoline taxes, the buildout of public transit, strict fuel efficiency rules, incentives for EV adoption, disincentives for ICE vehicle ownership—these are the tools by which California finally got petrol consumption under control. The prize? Five straight years of gasoline consumption decline, and a peak of consumption that is now 20 years in the rearview mirror.
Why is this potentially a useful model? Let’s consider the reasons:
• California was the epicenter of postwar suburban growth, and automobile ownership was the price of admission to this system. Indeed, it’s still the case that the five counties of Southern California house a seriously large chunk of the total U.S. vehicle fleet. It would be hard to find a domain with richer, longer-lasting car penetration.
• No consideration of offshoring or industrial production moving to Asia interferes with this particular example. Indeed, personal vehicle ownership was and remains a very domain specific condition of the U.S. and the Golden State in particular.
• Getting gasoline consumption to decline wasn’t easy, and took a long time, even with the array of policies that began to appear after 2005 (the peak). This demonstrates that, contra human intuitions, declines after peak do not show up quickly, but take a long time to appear.
• You have to be far more cautious in calling peak in any data series. Peak emissions, peak coal, peak road fuel—all of these tantalizing prospects have reeled in unsuspecting analysts over the years, only to spit them back out. Here at Cold Eye Earth, we followed this data series for 20 years, watched and waited to see how the policies would stack up, before finally, in 2022, declaring that the moment had finally arrived.
Where might be the best area to try and apply this model? Global road fuel consumption seems like a good place to start. California and Europe have of course been joined now by China in EV adoption. Unsurprisingly, when China joined in they went big as always, quickly establishing leadership and blowing our minds with the rate at which they have taken up EVs. The result is that they are starting to get road fuel growth under control. And if China is getting petrol consumption growth under control, that definitely steers the world in the same direction.
Early indications are that global emissions will grow by about 0.8% this year. The quick assessment comes from Glen Peters at Oslo-based CICERO after his review of mid-year IEA reports on coal, natural gas, and oil. Here is Peters on BlueSky:

Readers should also be aware that the IEA just released its other, main mid-year report on Electricity. According to the IEA, overall demand growth for power will ease this year and next, compared to last year’s heady 4.4% growth, by stepping down to 3.3% in 2025 and 3.7% in 2026. Let’s recall the Cold Eye Earth guidance that when it comes to forecasting and analyzing decarbonization progress in power, the total growth rate is far more important that the growth of wind and solar. So, a less elevated growth path this year and next will prepare the ground for wind and solar to make very strong contributions. Because they covered 50% of total 2024 growth, they should be expected to do at least that well this year, if not better.
—Gregor Macdonald