
Off the Rails
Monday 31 March 2025


In forecasting, sometimes the simple approach works best. Cold Eye Earth typically uses trailing five-year compound annual growth rates (CAGR) when making one-year growth forecasts for wind+solar generation, and total demand for global power. This avoids the granular, region by region approach often taken up by think-tanks and other professionals—which requires alot more labor—and which is quite superior for detecting short-term trend changes. The five year CAGR approach, on the other hand, is long enough to obtain a series of values that captures recent activity, but not so long to be unduly affected by older rates of growth that have likely gone stale. No special talent or expertise is required either, to apply a trailing CAGR to the near future. Indeed, the only discretionary decision made here by Cold Eye Earth is to prefer the five-year rate to the ten-year rate, or some other time period.
How is the method working out? Well, in 2023, Cold Eye Earth began to share the chart shown below with readers, indicating that combined generation of wind+solar would advance from 3427 to 3993 TWh, or 566 TWh, based on a five-year trailing CAGR of 16.6%. No polling, no news reports, no on the ground staff. The following year, when EI Statistical Review released the actual data for 2023, they arrived at this result: 537 TWh of generation growth for combined wind+solar. 566 vs 537? Pretty damn good.
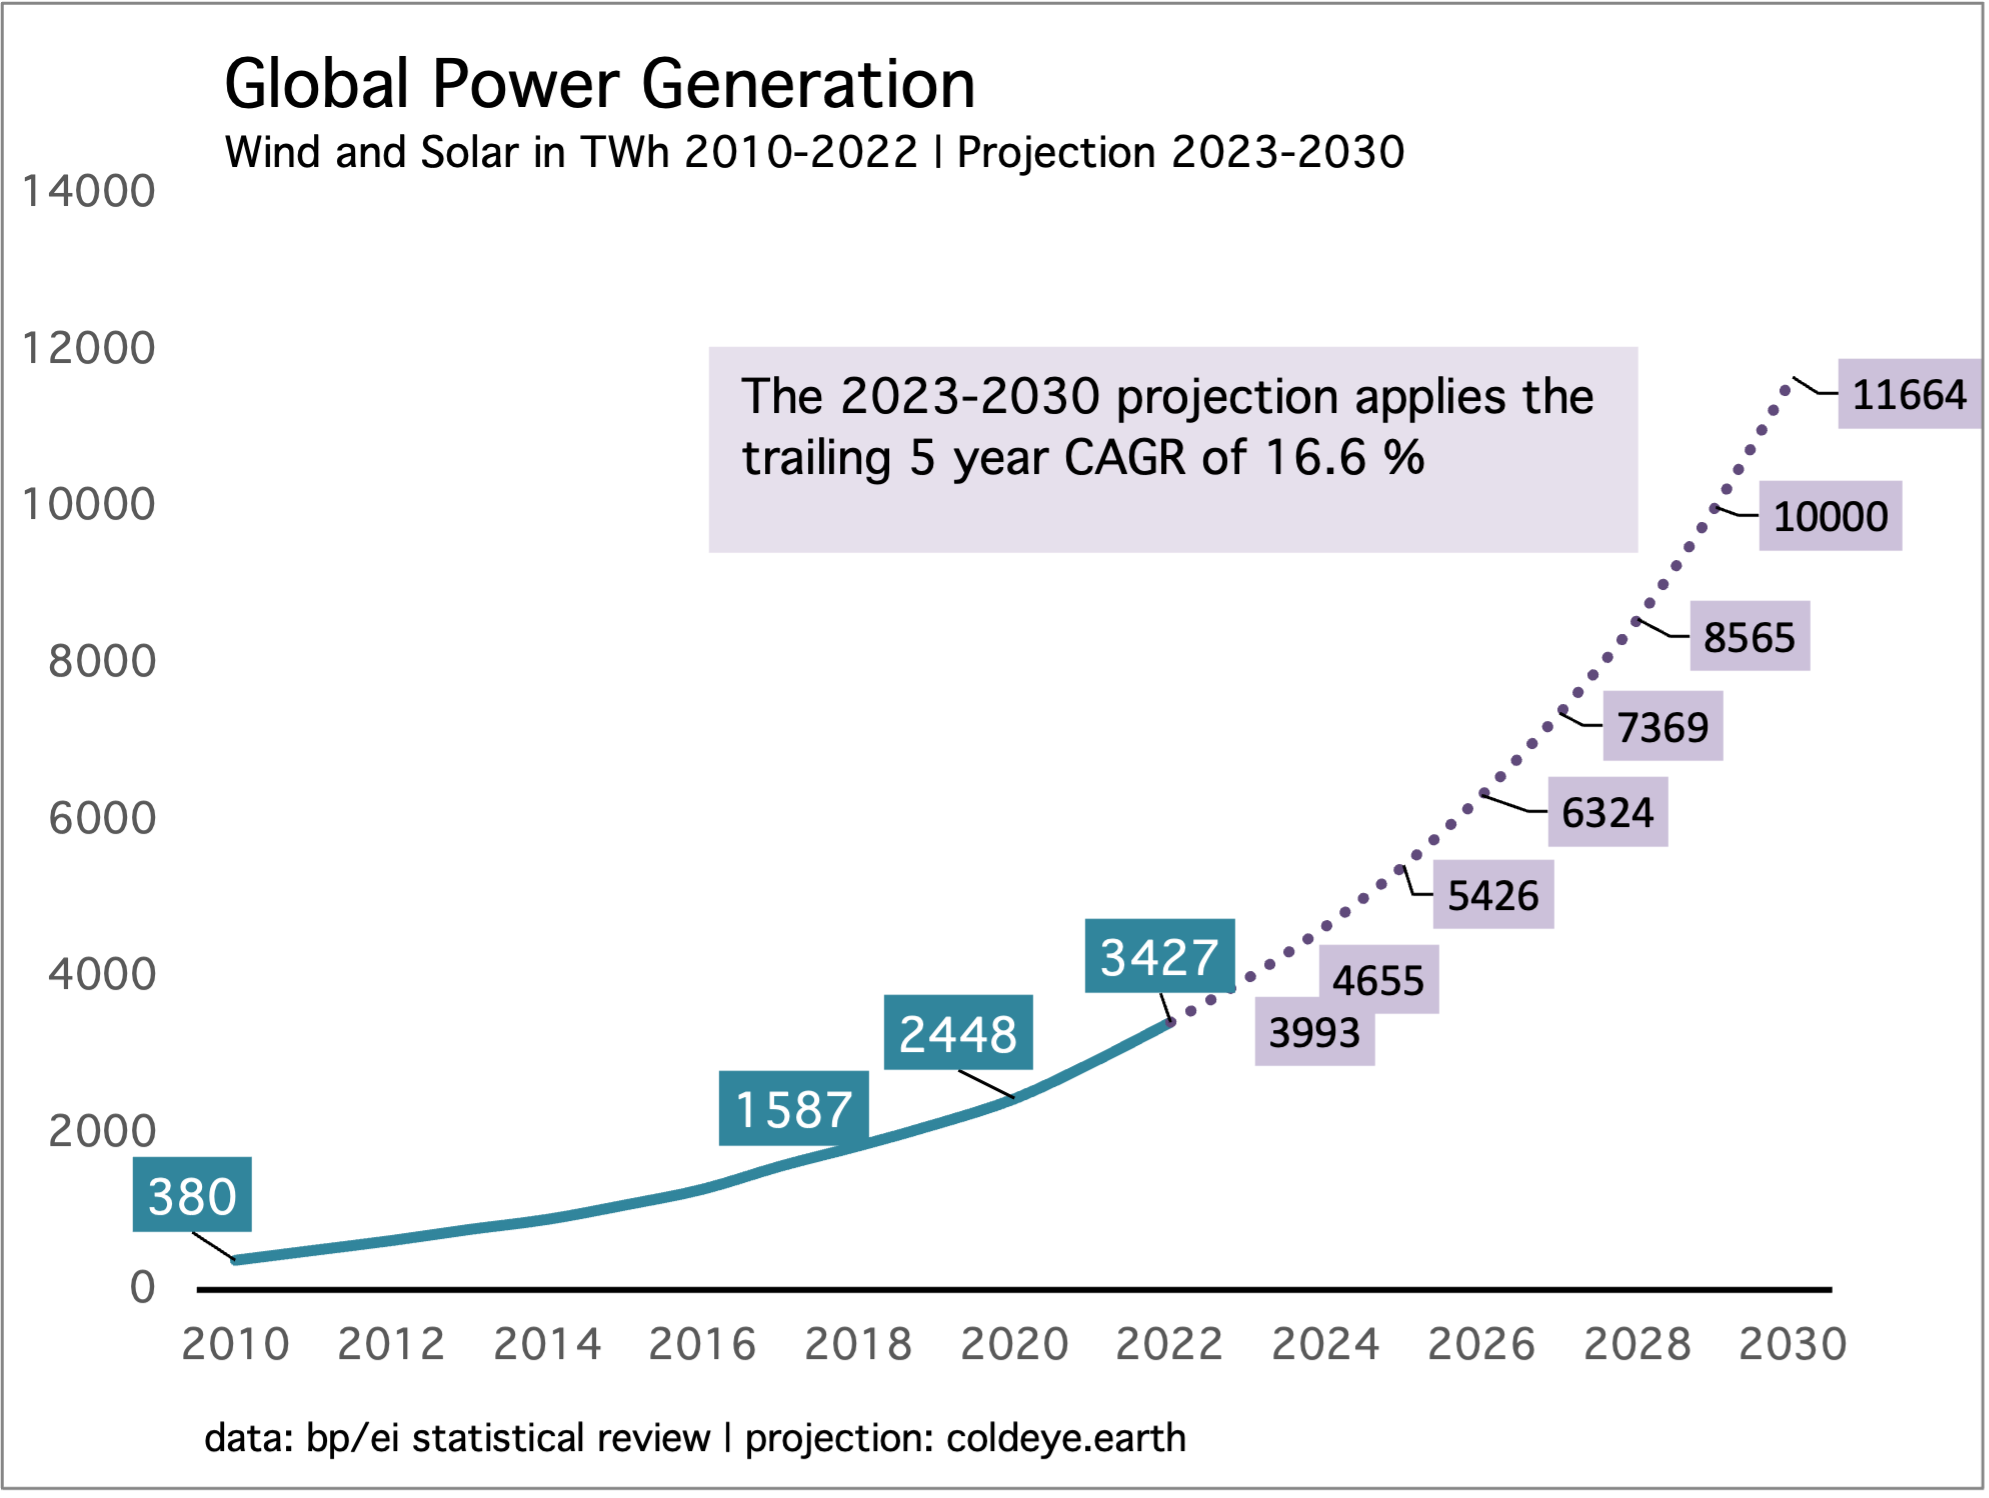
Notice that there’s no expectation either that the five-year CAGR is perfect. The forecast got within 5%, which is an excellent result, and more than adequately meets the needs of professionals working in this area. Just to remind: the lengthier the time period of the forecast, the more unreliable it will be. So, while the five-year CAGR projection works great on a one-year forward basis, you can see that the above chart goes out to 2030—and during that time there is certain to be unexpected growth volatility (lower, or higher). To make this plain: that figure for 2030 of 11664 TWh is sure to be some distance from the actual result. Let’s hope it’s higher!
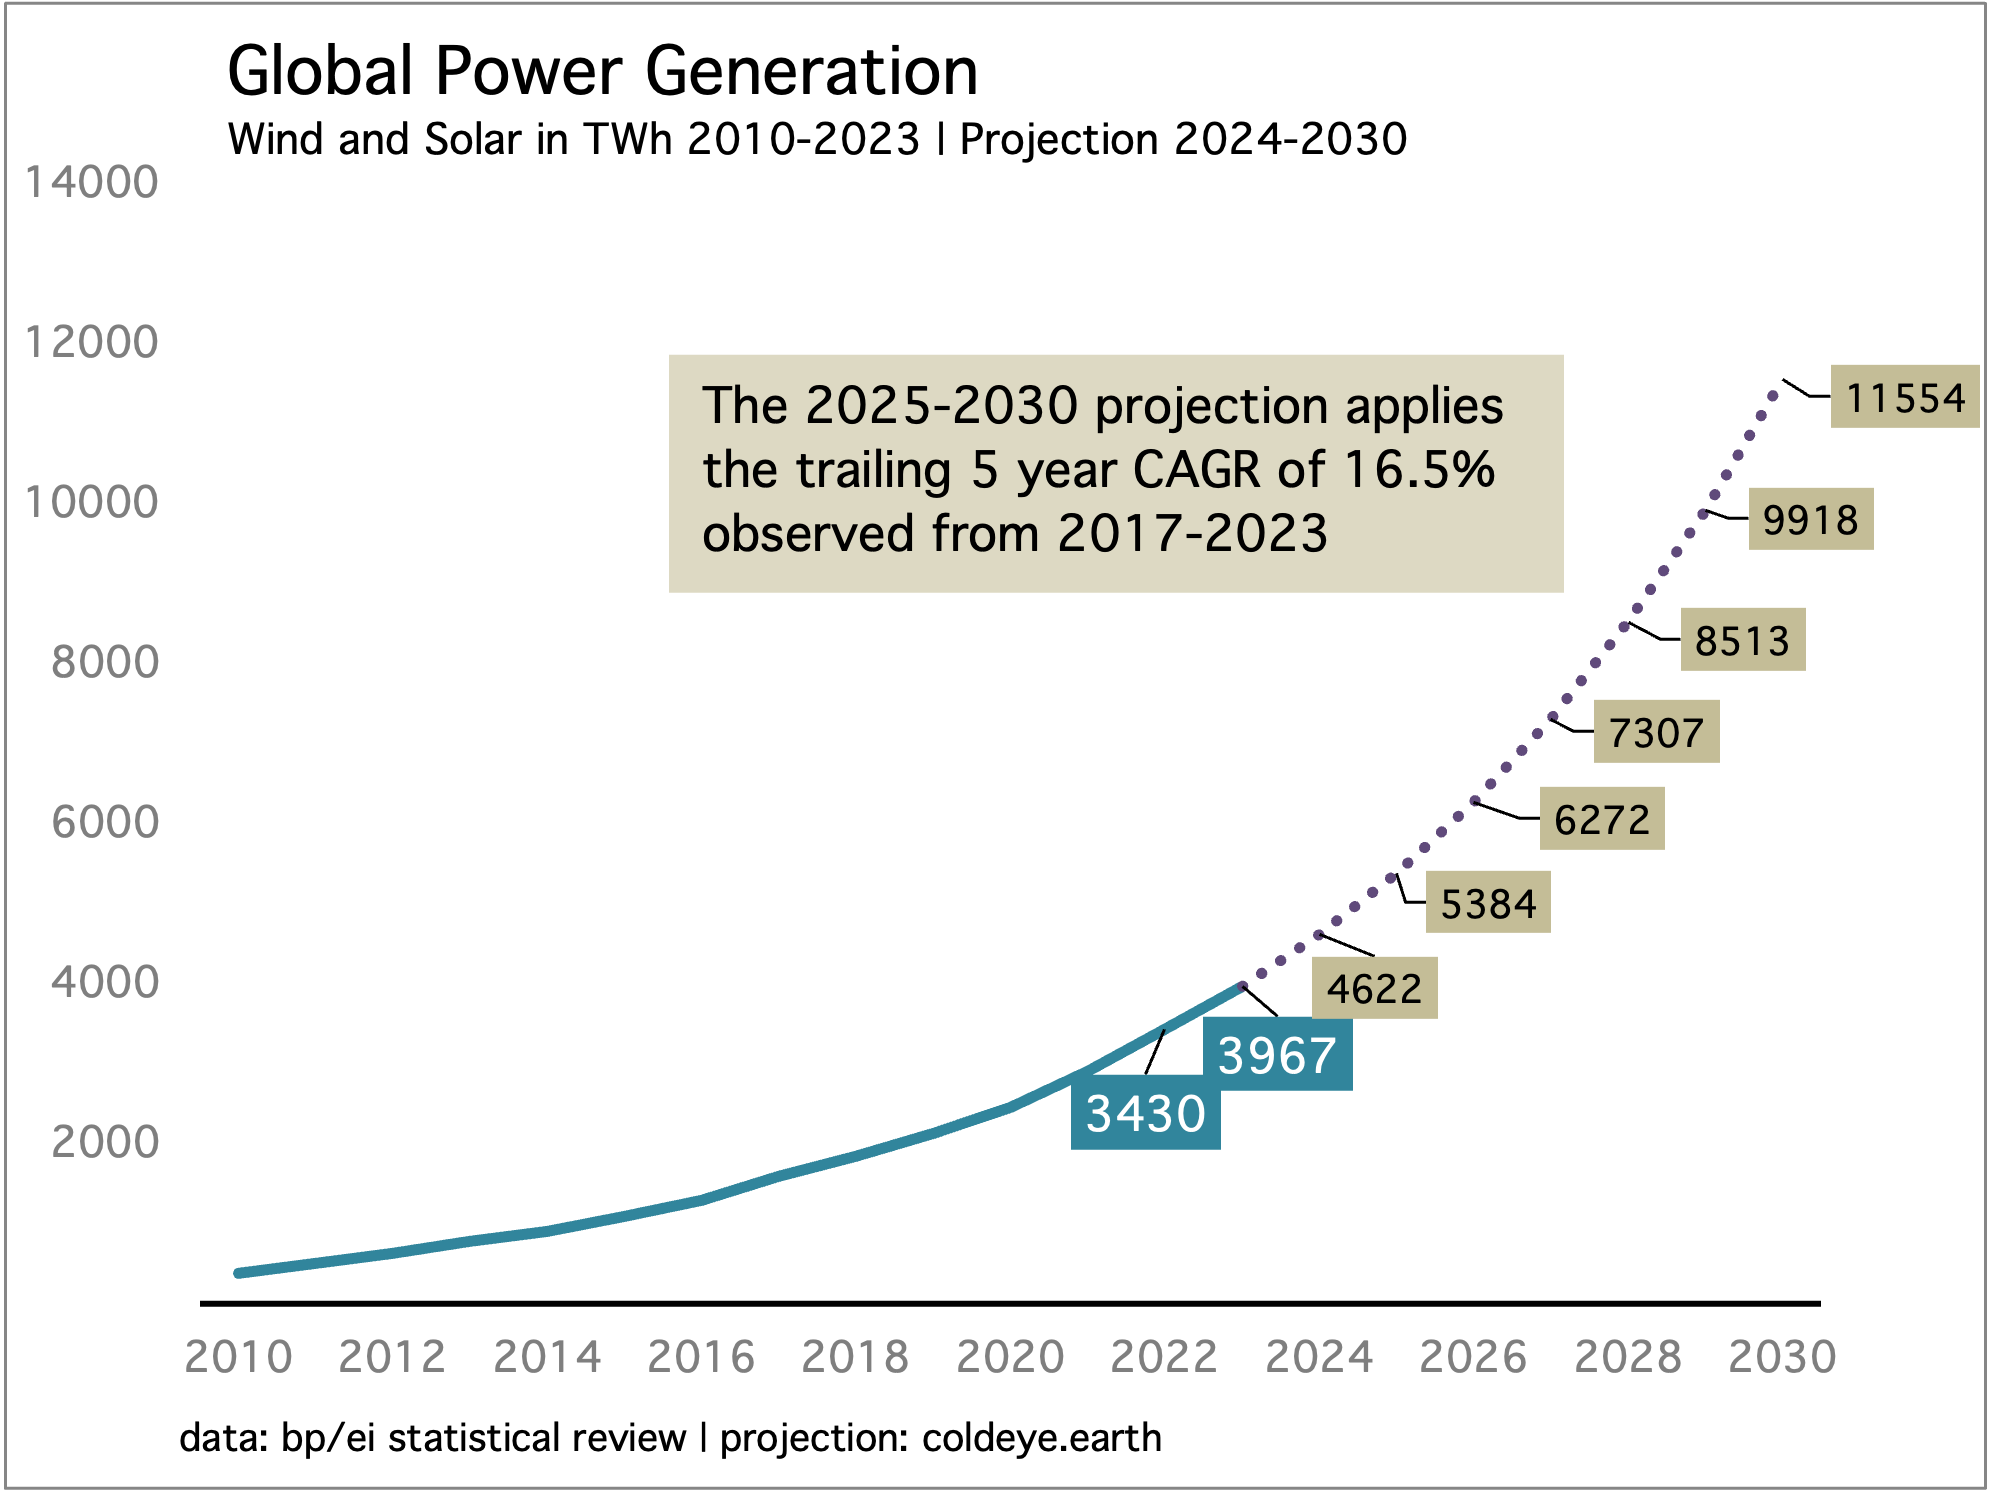
And how about for 2024? Starting this year, Cold Eye Earth began to share with readers the following chart, showing that the one-year forward growth of combined wind+solar was expected to advance by 655 TWh (3967 to 4622 TWh), based on a trailing five-year CAGR of 16.5%. While we don’t have data yet from EI Statistical Review, and we are still working with various estimates from all the think-tanks, we did just get the first official estimate of 2024 wind and solar growth from the IEA in Paris. Their number? 670 TWh. 655 vs 670? That is amazing.
The data comes from the IEA’s just released Energy Review 2025:
Global electricity consumption rose by nearly 1100 terawatt-hours (TWh) in 2024, more than twice the annual average increase over the past decade. The increase – more than Japan’s annual electricity consumption – was the largest ever, outside of years when the global economy rebounded from recession. China made up more than half of the global increase in electricity demand, but the rise was broad-based, with growth of 4% in other emerging and developing economies. Electricity demand reached a new high in advanced economies…Generation from solar PV and wind increased by a record 670 TWh, while generation from natural gas rose by 170 TWh and coal by 90 TWh.
If you are wondering what will be the next one-year forward forecast, you can just grab that 5384 TWh number from the above chart, for 2025. Because this year’s forecast was so close to the actual, it won’t change the trailing five-year CAGR to be applied, and thus the calculation is already done, in this chart. One cautionary note: the month of March is a pretty early estimate for 2024’s wind and solar growth, and EI Statistical Review (which is engaged in the same analysis) won’t release its data until early summer. When EI does release their data, we will make up the final projection for next year.
Needless to say we’re still not at peak emissions in the power sector, and those who make such forecasts are wasting your time, and should not be taken seriously. Thermal energy sources, natural gas and coal, are still growing incrementally in global power even as combined wind and solar get better and better at taking 100% of marginal growth. To illustrate, here is the IEA’s estimate of each energy source’s growth last year in global power. | see: Electricity, Global Energy Review 2025.
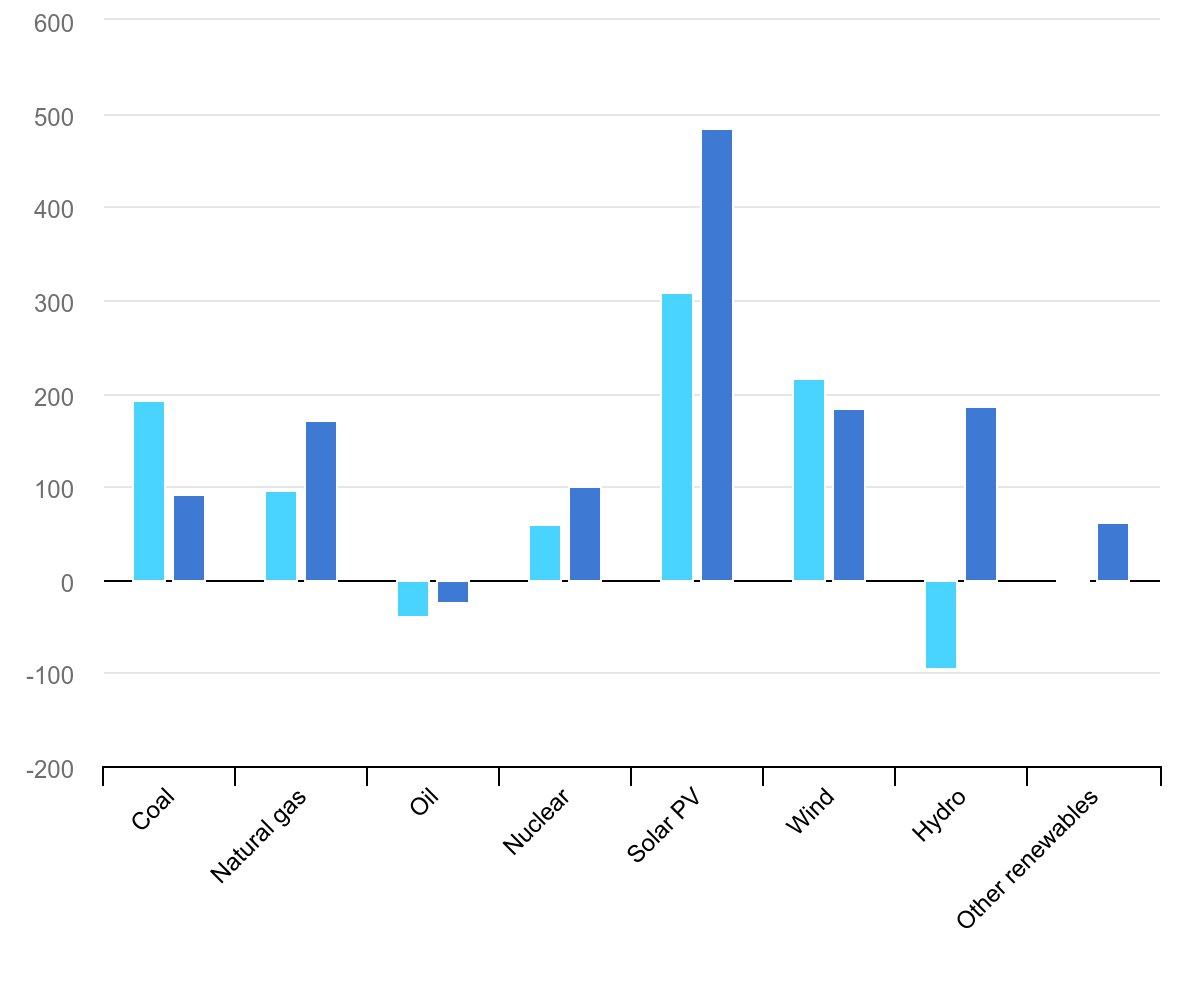
While it’s encouraging that both nuclear and hydro advanced last year, the latter remains volatile—helping in some years, and hurting in other years. As for nuclear, there’s a decent prospect we get incremental help from that source in the next few years as long as retirements are slowed, new capacity comes online, and old capacity is resurrected. That’s alot to ask for, and is partly why Cold Eye Earth advises against using a big, broad “renewables basket” that lumps nuclear, hydro, and worst of all, biofuels, into a single category.
Just to remind: it’s not clear how much net energy we get from biofuels after you take into account the energy required to produce and ship them. It is one thing for pre-industrial humans to gather firewood or dung to use for heat and cooking. It is quite another to manufacture wood pellets on an industrial scale, to be burned at a distant, thermal powerplant. What’s the math on that process? The energy return on energy investment has to be low, and may even be negative.
The US oil and gas industry is hopping mad at the Trump administration. Yes, you read that right. Readers of Cold Eye Earth will recall the infamous Dallas Fed survey which comes out every quarter and includes feedback and commentary from local business leaders—especially from the oil and gas industry. Throughout the entire Biden administration, as the industry boomed, the complaining and the bitterness reached very high levels in the Dallas Fed’s quarterly letter. The truth: the industry rarely had it so good. From the 6 March 2023 newsletter, Energy and the Presidents:
One of the more amusing versions of this argument can be observed each quarter in the respondent survey of the Dallas Fed, in which participants complain bitterly that the Biden administration is destroying the US oil and gas industry. The Biden administration has certainly engaged in some harsh rhetoric about oil and gas. But the rhetoric is all for show. There are no policies, outside the normal course of regulations that have lumbered forward in the US for a century, inhibiting US oil and gas production. The US is now a robust exporter of petroleum products, and as important, is the new giant of LNG exports, as it takes the number one position this year from Australia. Today, the US stands as a global titan of fossil fuel production, and ranks second only to China as a producer of energy from all sources. Constrained? Not even a little.
By some measures, the industry is angrier now because they finally have something tangible to be mad about: tariffs, and how they are raising the cost of critical parts. Here is a sampling from this quarter’s commentary:
The administration's chaos is a disaster for the commodity markets. "Drill, baby, drill" is nothing short of a myth and populist rallying cry. Tariff policy is impossible for us to predict and doesn't have a clear goal. We want more stability.
The administration’s tariffs immediately increased the cost of our casing and tubing by 25 percent even though inventory costs our pipe brokers less. U.S. tubular manufacturers immediately raised their prices to reflect the anticipated tariffs on steel. The threat of $50 oil prices by the administration has caused our firm to reduce its 2025 and 2026 capital expenditures. "Drill, baby, drill" does not work with $50 per barrel oil. Rigs will get dropped, employment in the oil industry will decrease, and U.S. oil production will decline as it did during COVID-19.
As Cold Eye Earth has discussed in several issues this year: the inflation adjusted price for natural gas and oil is so low, that oil and gas companies are already being squeezed because every cost in the industry’s universe from labor to steel to tech, engineering, and exploration has gone up substantially in the past two decades. It would be as if apples were trading at prices from twenty years ago but all your labor and machinery had never stopped rising in price. The only possible intermediary in such equations is productivity of course, and we should impute that dynamic to the oil and gas industry.
However, the President is functionally demanding that the industry suck it up and deal with it when it comes to higher input costs, while also stating he will pursue a production policy that will lower oil prices even further! Can you say margin squeeze? Even more amazing is that the President is basically sending the same message now to the auto industry, on one hand undertaking tariffs that will increase the cost of parts and steel, while following that up with a warning to the industry to not raise prices. What world are we living in?

Texas has just 75% of the population of California, so why is the Lone Star State’s energy consumption so much higher than the Golden State’s? Answer: industrialism and population growth.
As it happens, industrialism, economic growth, and population growth present the greatest hurdles for energy transition—so comparing California’s power sector profile to Texas is going to yield some useful insights. Let’s start with California, which is now a global giant of wind and solar, as those two sources last year provided a very impressive 38.8% of total electricity sales in the state. Just to say: that is far above wind and solar penetration in the EU, for example. California saw excellent growth of wind and solar last year. Indeed, the two sources enjoyed an acceleration in 2024, growing 14.3% from the year prior, when 2023 growth only came in at half that rate, 7.00%, compared to 2022.
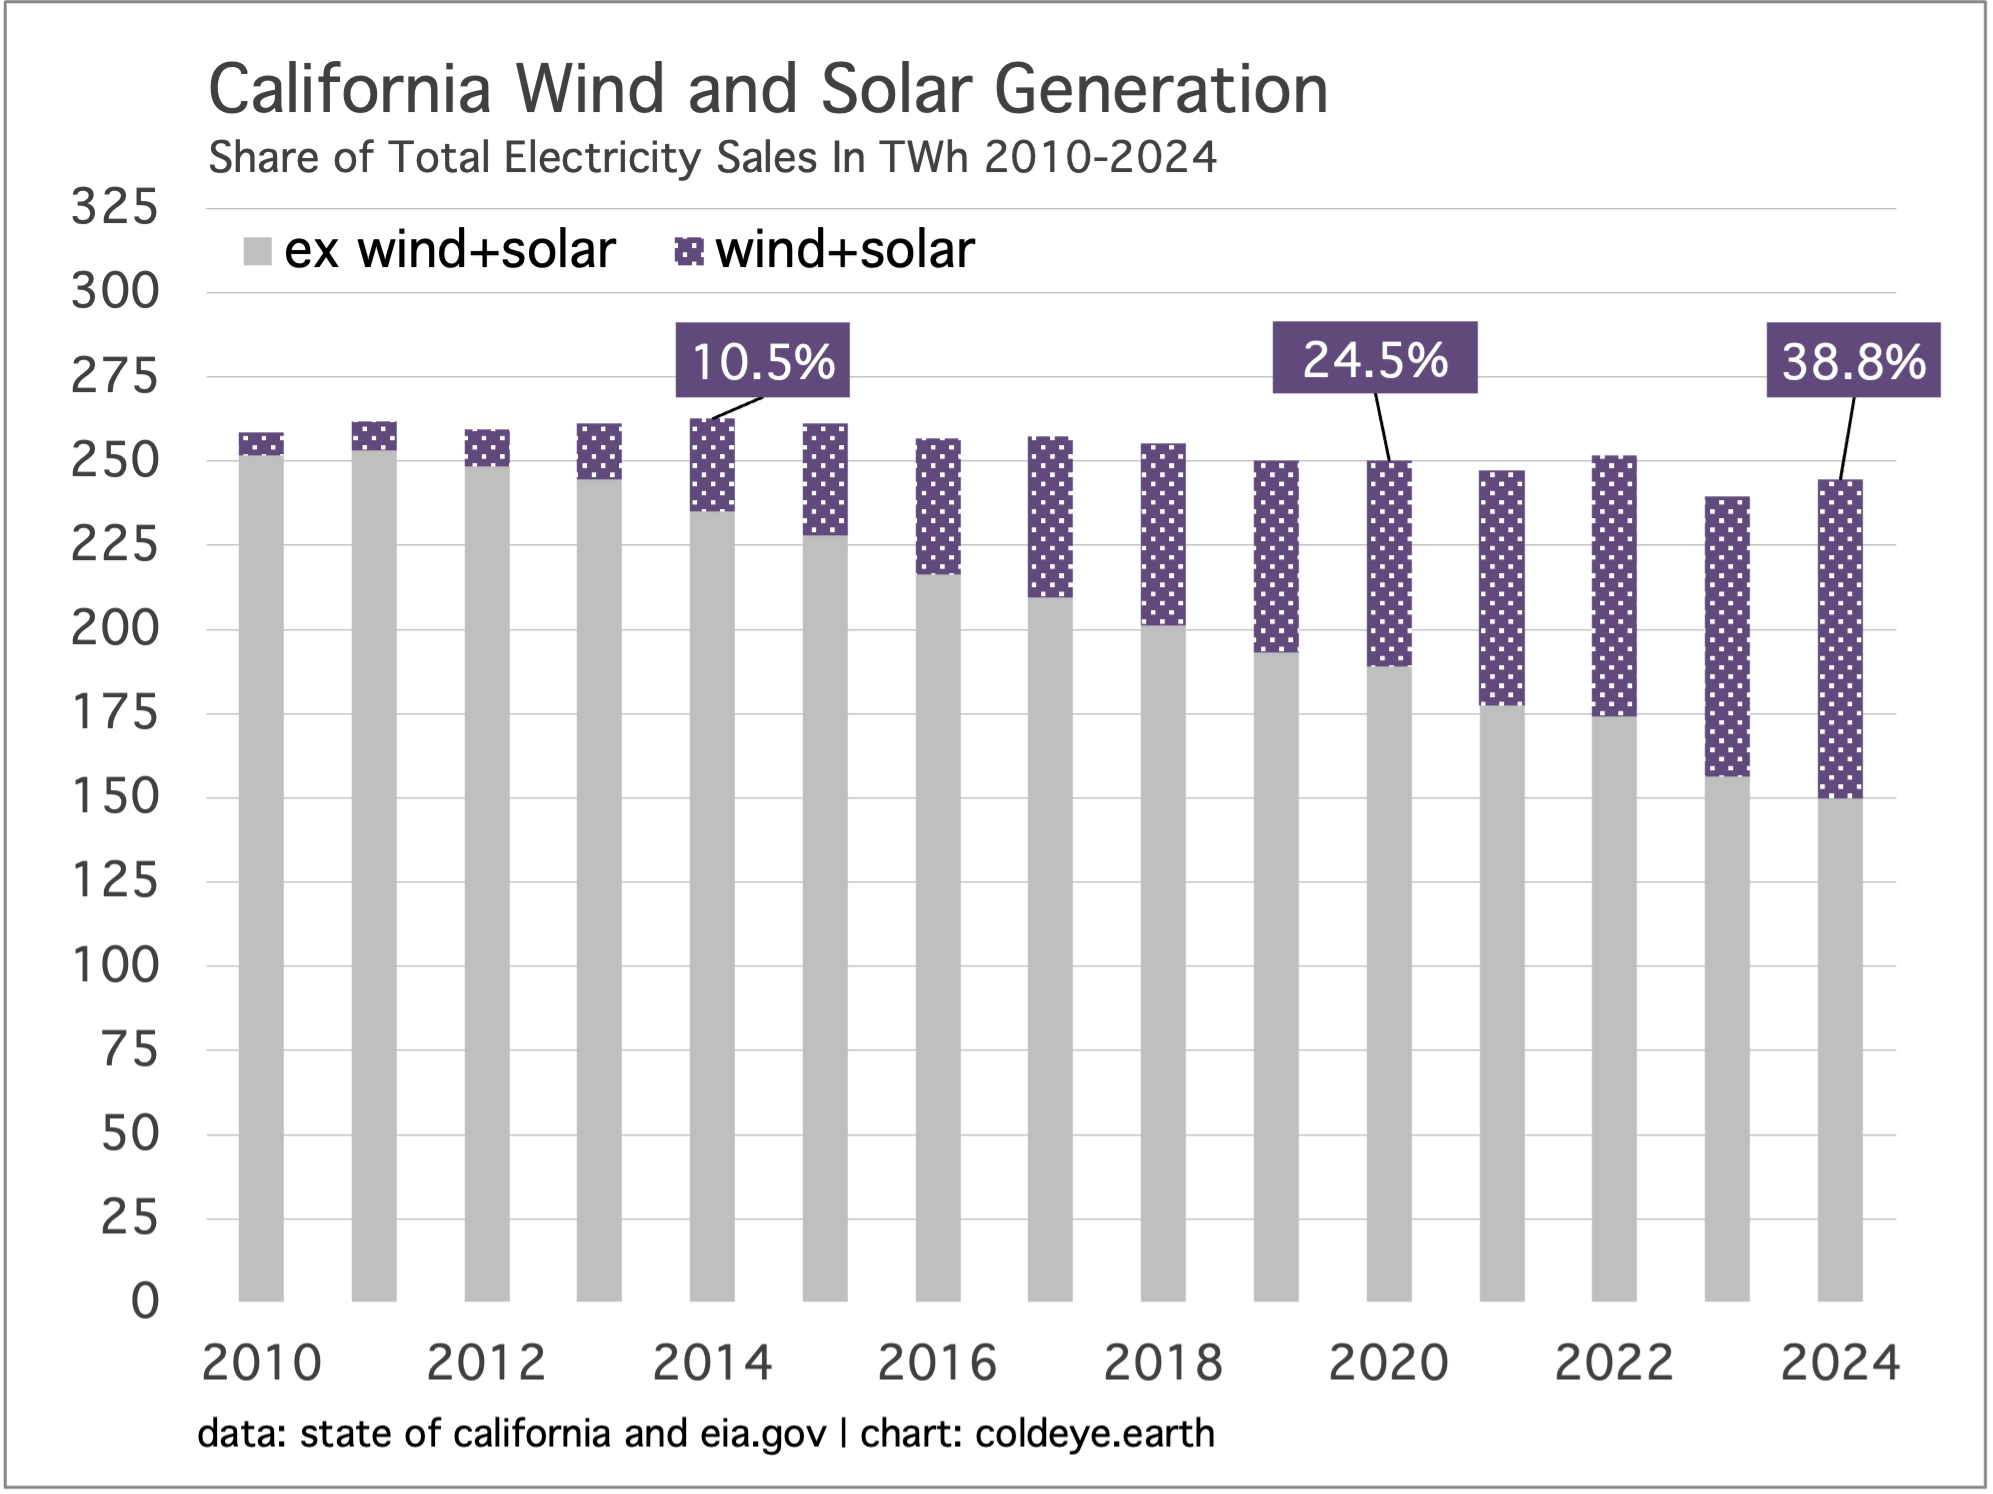
Notice however, that an even more important phenomenon has been realized in California over the past decade: energy sources ex wind+solar have long since entered decline. Woo-hoo! The biggest cause of that decline? Well, the growth of wind and solar is quite obviously a strong component of that decline but the most important factor is that California electricity demand is not growing. Look at that flatline, hugging the 250 TWh level for years, and remember the general principle: when national power demand is not growing, it becomes far easier for wind+solar to penetrate the underlying fossil fuel layer. And look at the beautiful decline, of that layer.
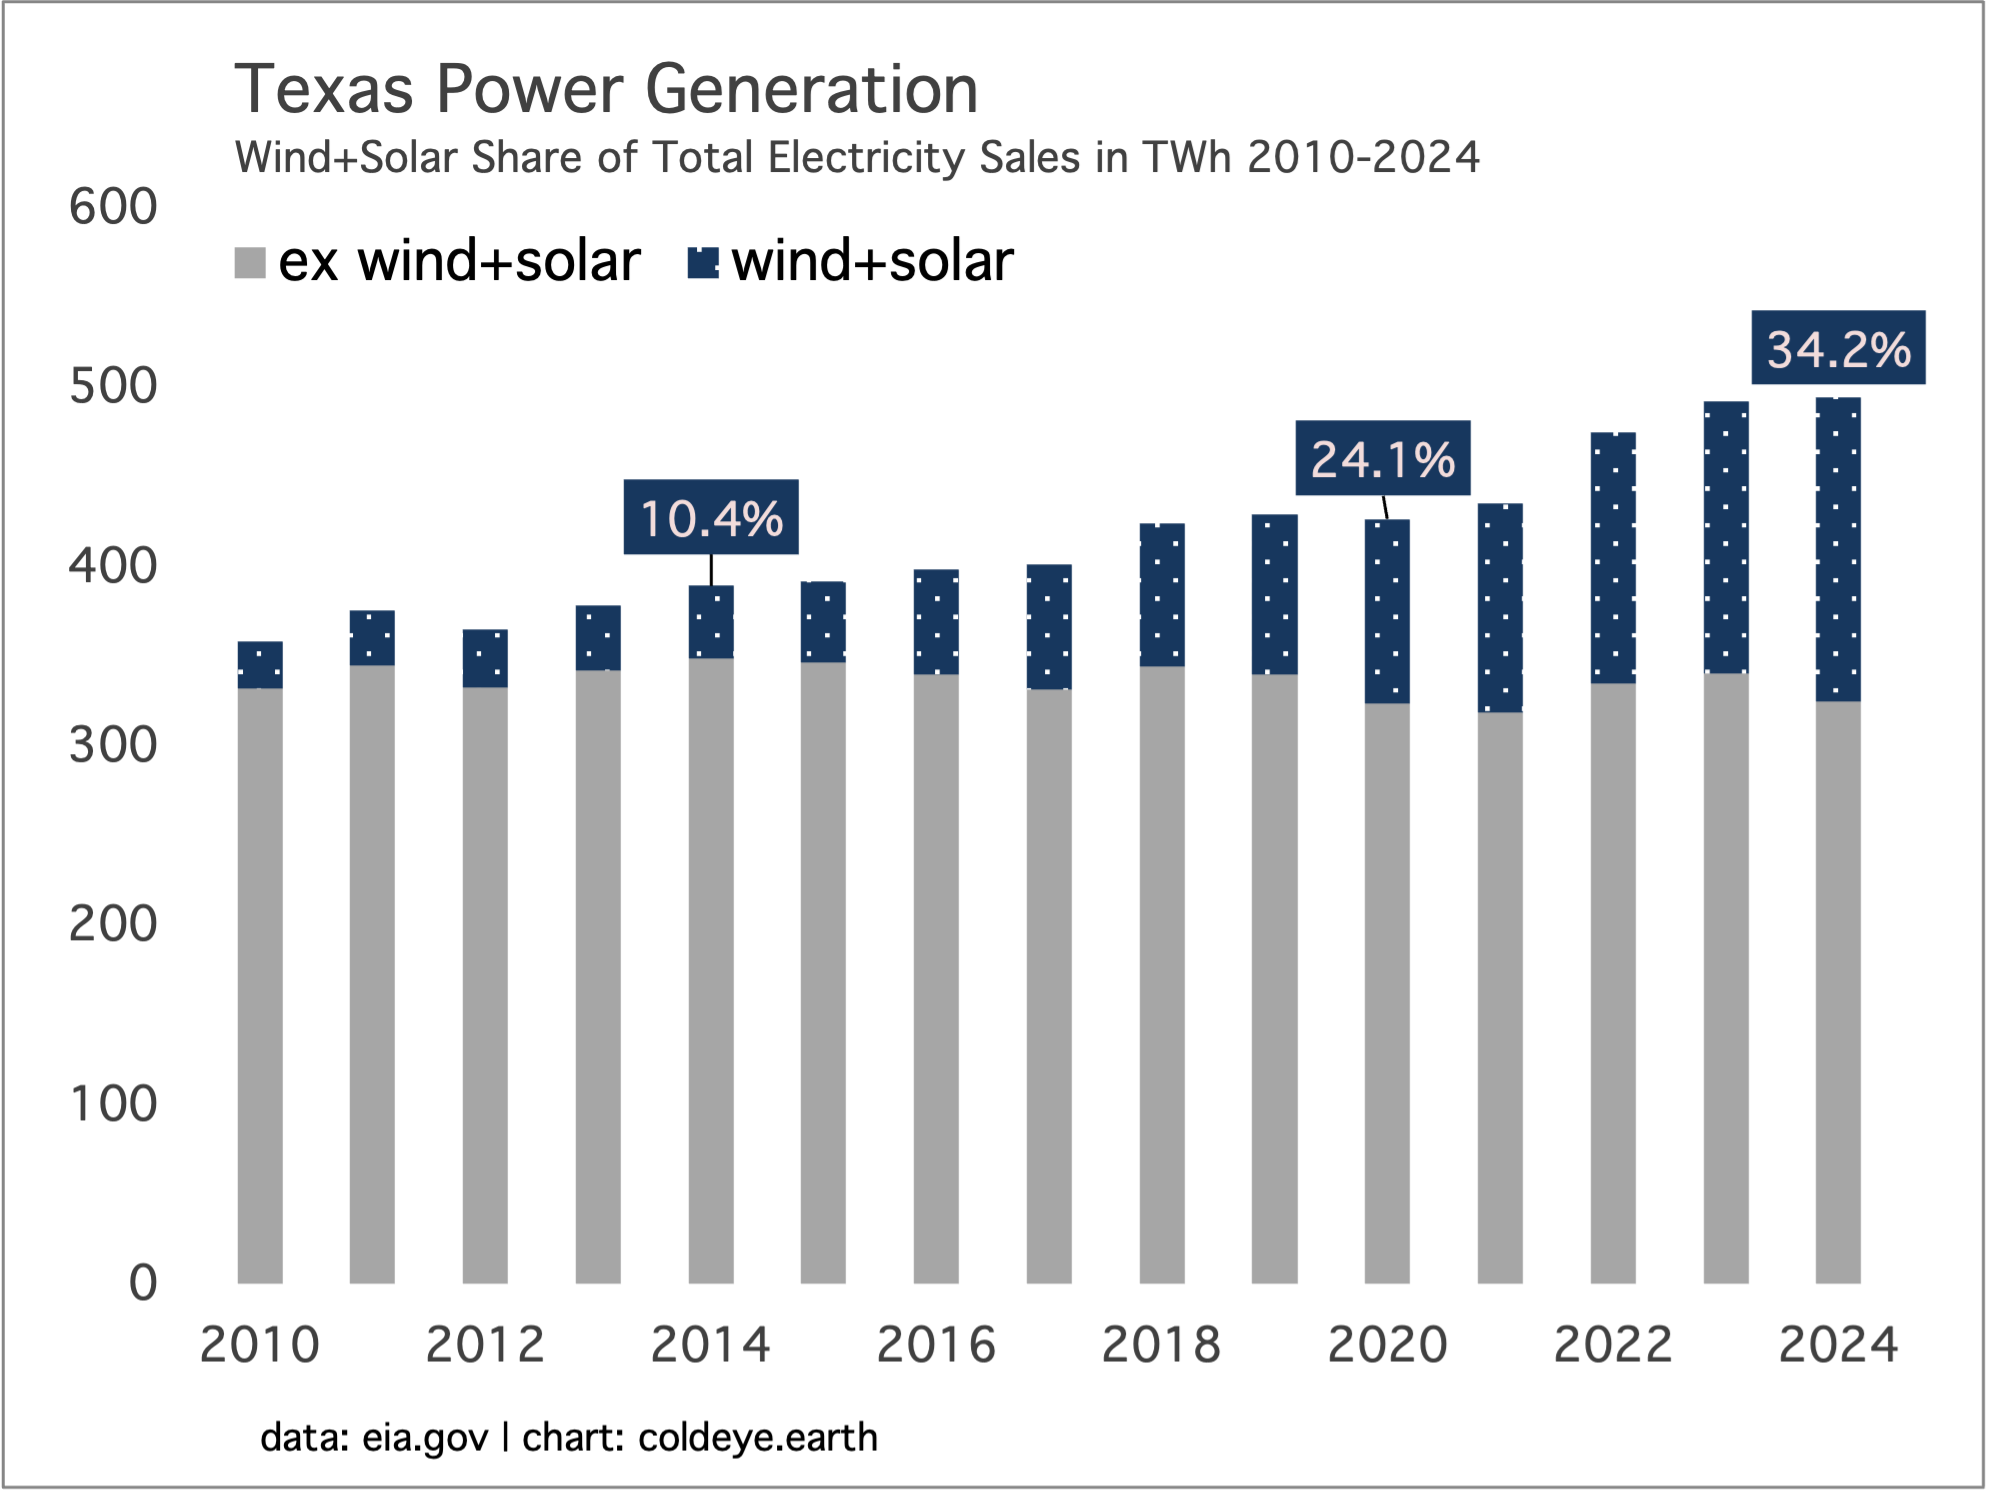
Texas meanwhile, again with a population that’s about 25% lower than California’s (30 million vs 40 million) consumes almost twice as much power each year than the Golden State. Why? Manufacturing, petrochemical operations, and population growth. For example, California is the nation’s top manufacturer in absolute terms, but Texas manufacturing (number two in absolute terms) is far more intense in relative terms to population. The petrochemical sector meanwhile, along with air conditioning, is a big driver of power demand, and finally we have population growth.
Two lenses in which to see that growth. First, California’s population stalled out around the 40 million mark 7-8 years ago. But not Texas, which has nearly added another 2 million people just since the year 2020! Second, which state is losing seats in Congress and which state is gaining? By the year 2030, California is on course to lose 4 seats and Texas is on course to gain 4.
The world is not like California. The world is more like Texas: population growth, economic growth, and alot of dirty industrial activity. In California, the flatline in its power sector can be located in the evolution of total electricity demand, which is not growing. In Texas, by contrast, the flatline can be found in the ex wind+solar category, which is not growing—but not declining either. Because the world is more like Texas than California, energy transition will continue to be road-blocked by a group of challenges which are simply too hard for wind and solar to conquer at the same time: covering all marginal growth in power; keeping up with industrial and population growth; while at the same time digging into the fossil fuel underlayer.
And we know why: while new wind and new solar are affordable enough to win the race (mostly) for marginal growth in global power, they are not cheap enough to allow owners of incumbent power capacity to simply toss their infrastructure away. This is the blind spot that governs alot of hope and expectation in the climate community, especially among those who undertake the futility of trying to predict peak emissions in power. The existing capital stock of global power capacity is protected by a fair amount of inertia—some of it is policy meant to ensure the stability of existing grids, but the bulk of it centers on the value-retention of incumbent power, because the costs required to generate a unit of incumbent power are low. Too low to be easily dislodged by wind and solar.
Let’s complete this line of thought with the following example: a family keeps a 2010 Toyota in the garage so their two college students can drive it when they are home for summer, working jobs. No one in the family loves the Toyota, and they are all math literate and understand that running costs for a new EV would be far lower. Ah, but the EV represents a new capital cost to the family, whereas the 2010 Toyota is already paid for. So the value proposition of the 2010 Toyota is poor if you were buying it today off a used car lot. But not if you already own it. The value proposition of keeping the Toyota, the value to be captured in its ongoing utility, therefore, is excellent. And the majority of the world’s coal and natural gas plants have the same value proposition as the Toyota. The power industry is delighted to build new wind, solar, and storage. It is not be delighted and will not cut itself off from the ongoing value proposition of their existing capacity from which they can extract positive economic value for years to come.
—Gregor Macdonald