
Offshore Gold
Monday 24 August 2020

A new offshore wind industry is about to deliver a long cycle of economic development to several long-forgotten regions of the US east coast. Earlier this summer, the State of New Jersey announced a major wind port project to be developed on its far southern coast, on land with western facing frontage along the Delaware River. The location offers two features crucial to full participation in the offshore supply-chain: stable soil across large acreage sufficient to manufacture, house, and deploy enormously large blades and turbines, and, unrestricted overhead access to the open ocean. In a poetic twist, the project will be sited immediately adjacent to the Hope Creek nuclear generating station.

As we’ve learned from Europe (whose industry is now quite mature by comparison) the supply chain for offshore wind very easily proceeds along networks of widely dispersed locations, as distance itself becomes trivial in seaborne transport. The port of Hull in the UK, for example, has grown into a major center for project deployment not just around the UK, but in Europe. The Hancock, New Jersey location therefore could easily serve projects up the coast to Massachusetts or down to the Carolinas. Construction is set to begin next year.
Perhaps the most intriguing opportunity provided by an emerging offshore wind industry is that it will necessarily scout for long dormant locations, up and down the East Coast. I reported on the early promise of these impacts last year, with respect to port development in New Bedford, Massachusetts and New London, Connecticut. Now comes the Hudson River Valley (another post industrial region), following in the footsteps of New Jersey, with its own poetic twist: The Indian Point nuclear power plant at Port Cortlandt has now appeared on a list of eligible ports to the serve a new industry, along with several other locations as far north as Albany.
It might be time to remind readers that the enormous economic expansion of the late 18th and early 19th centuries produced enough capital to fund the buildout of the Erie Canal, which leveraged the Hudson into a cross-state waterway connecting New York Harbor to the Great Lakes. That era has long since slipped into the rearview of history, along with whaling, textiles, fishing, and clipper ships. But a new offshore wind industry, set to invest at least $70 billion over the next 10-15 years, will provide both substantial capital and operational expenditures to regions such as these.

The economics of offshore wind remain quite surprising, as we have travelled in about ten years time from a technology that was enormously expensive, requiring deep subsidies, to an inflection point. The game was always clear: how to capture the greater volumes of wind available offshore with devices large enough, efficient enough, and affordable enough—while also perfecting the economics of deployment itself—to make it all worthwhile. One metric sticks with me, from my interview last year of Willett Kempton at the Special Initiative on Offshore Wind at the University of Delaware: each time manufacturers double the size of the blades, the cost of obtaining the energy falls by a third. The achievement is tangentially reminiscent of the fact that the world’s oceans likely contain far more gold in dust form than all the gold that’s ever been mined. But the cost to extract it would make gold-dust-harvesting from the sea an entirely pointless endeavor. In some sense, offshore wind cracked that code, converting what was once a hopelessly uneconomic energy-quest into a viable technology. | see: the evolution of offshore wind turbine size, in comparison to well known London skyscrapers, via the UK Wind Deal site.

Speaking of theoretical gold, it might be a good time to check in on actual silver and the role it plays in solar manufacturing. As most may know, silver is a component of photovoltaics (PV), and according to the Silver Institute composes about 10% of total global annual demand for silver. But what is the trend? PV output has soared the past decade and that raises familiar concerns about material costs and availability, as intuitions tell observers that demand could lead to shortages. This is an oft-repeated concern across the renewable space, especially for rare earth metals. Well, it turns out, the learning rate (again) has something to say. Unsurprisingly, manufacturing efficiencies over time wring out savings and that invariably means producing either greater volumes with the same quantity of inputs or the same volume with fewer inputs. Something like this is happening with silver demand and PV output, though, we might want to inspect recent trends before we come to any hard conclusions.
First, Nat Bullard of Bloomberg very helpfully charted the ascent of PV demand for silver at a time when demand from the photography sector has been in long term decline. As you can see, PV demand for silver has indeed been rising in absolute terms (the first chart). But more importantly, PV demand for silver on a unit basis portrays a far gentler rate of increase (the second chart), as the industry clearly has found a way to use less silver per unit of output. That’s our friend at work, the learning rate.


OK, all fine and good. That said, the global silver industry clearly is ever more reliant on PV demand these days, having lost photography as a sustaining demand center during the 20th century. However, it’s also clear the PV industry is driving a meaningful increase in demand for silver, even if softened by the miracle of the learning rate. Indeed, when you inspect the table offered up at the Silver Institute link, the steady call currently, of roughly 100 million ounces a year, does represent a doubling from earlier in the decade.
With some caution, I am going to offer up a shortcut conclusion about this portrait of industrial material demand, as the pattern has been seen elsewhere: deployment of new energy infrastructure across the world really will drive material demand higher on an absolute basis, but probably not at a rate that produces throughput-halting shortages. As with all shortcuts, however, you can’t set them and forget them. So, tracking material demand will always be necessary, and require updating.
Ember, the London based think-tank providing better up-to-date portraits of global electricity, showed that global coal is now under full assault from wind and solar.

In Ember’s recently released Half Year Electricity Analysis report, combined wind and solar rose 14% through the first six months of 2020, and now approaches 10% of global electricity. (For your dear old friend who told you ‘wind and solar are great, but they’ll never scale,’ this will surely be a handy statistic to share). Perhaps the most stunning result is that the global coal fleet has been running less than half the time. That suggests looming, growing overcapacity and inefficiency which—in the future—could play a role in the collapse-path that is now coal’s fate.

Powergrid blackouts in California were quickly assumed to be the result of too much VRE (variable renewable energy) on the grid, but were mostly the result of over-cautious policy decisions. Furthermore, it’s going to take some time to fully assess the multi-factor nature of the blackouts. In a thoughtful post at RMI, authors Mark Dyson, Ben Serrurier, and Charles Teplin note that there is no perfectly reliable source of power, and California may have experienced a unique confluence of events, not dissimilar to myriad blackouts that have hit other domains, throughout history. More broadly, it needs reminding that many climate-change forecasts have long projected that even the best-designed powergrid management is likely to be overwhelmed at times by weather events that break away from existing models. That another round of widespread, devastating fires have now erupted just after the recent heatwave is cruelly unsurprising.

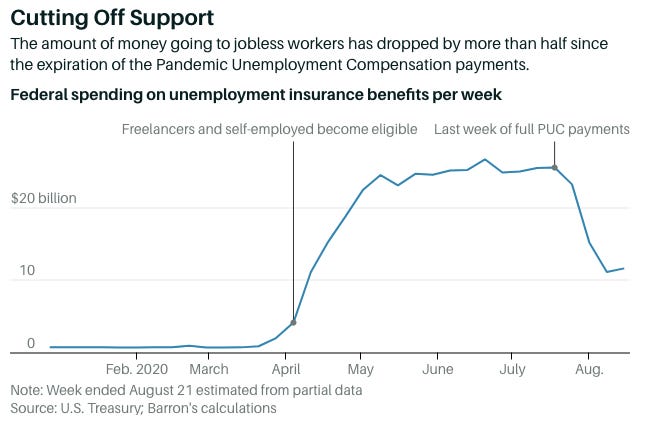
Consumer spending in California has entered a bumpy plateau over the past 6 weeks, after a strong recovery from a bottom, in late April. The data comes from Opportunity Insight’s economic tracker, a project at Harvard. More broadly, well known market and economy observer Mohamed El-Erian notes that in most of the world’s advanced economies, the V shaped recovery has now transitioned to more of a square root. The current delay in rolling out further stimulus here in the US is a primary cause, but we have to remember that the aggregate effect of suppressed trade and consumption globally is starting to become its own factor.

The decline of maintenance money going to jobless workers is steep, here in the US. In a very good piece at Barron’s, Matthew Klein speculated this week how the US central bank may react to a lull, or a second dip, in the US economy. Klein cites three possibilities: opening up a Municipal facility, and also a Main Street lending facility, and putting some downward pressure on the US Dollar. It’s my own view that the largest drag on any sustainable recovery will come from cities and states, which unlike the federal government cannot print money. It will take a long time therefore for states and cities to dig out of the hole, bereft as they are from tax receipts during the pandemic. Indeed, states in particular are likely to be the source of deflationary pressure(s) for some time to come, well into 2022. For more on that aspect of the story, please see this very good piece in the New York Times, State and Local Budget Pain Looms Over Economy’s Future.
In a related note, Andreas Steno Larsen this week—also speculating on further measures the US Fed could undertake, if it needs to—made the point in Nordea’s FX Weekly that any further weakness in the US Dollar would run straight into a European economy that would not want to see the EUR rise up above $1.20. Given that any beneficial effects of further weakness in the US Dollar are rather diffuse, it’s doubtful this lever would be pulled hard by the US Fed. That said, if the US Fed were to become more vocal about letting inflation run hot—theoretically speaking—that could indeed place some pressure on the dollar.
There is still no change to the Gregor Letter economic base case. The US economy remains trapped between a highly dysfunctional federal government that offers no guidance or tactical remedy to the pandemic, and, a looming election that pressages sweeping change in these and other policies. Accordingly, the US suffers from a haphazard, tragi-comic approach to the pandemic with everyone from state governors to university presidents making unbelievably thoughtless decisions. But, it must be said, this scrambled and embarrassing lack of leadership emanates entirely from the absence of any coherent, national level strategy.
The stock market meanwhile continues to trade on ultra-low interest rates, and an old dynamic now more than 25 years old, the Fed put. The idea here being that with interest rates so low, stocks are not merely the only alternative, but should they decline again, owners of stock can “put” them back to the Fed who will be doing everything possible to elevate their price level. A more benign phrasing, that describes the seeming disconnect between future economic growth, corporate earnings and stock prices, is simply the idea that you don’t fight the Fed.
The level of the stock market is hardly tangential, however, to the proceedings in Washington about a second stimulus package, and its urgency. Note how quickly Washington responded—the President, Congress—when stock prices endured one of the scariest and fastest declines ever, in March. Now, five months later, the SP500 hitting new highs, and the Nasdaq hitting even higher highs, does not exactly produce the same sense of urgency, to put it mildly. But worry not, if US stock markets decide the next stimulus package needs to come forth, those very same markets understand well how to spark immediate action.
It’s possible that OECD oil consumption is about to enter decline. For a full decade, all the growth in global oil consumption has entirely rested with demand in the Non-OECD. Indeed, OECD oil consumption last year, at 89.634 EJ was almost exactly at the same level of 2009, at 89.554 EJ. And you must remember, 2009 was a very bad year for OECD oil consumption, as western economies struggled with deep economic contraction. (Note, data going forward will more frequently use exajoules (EJ) as this is the unit now chosen by the BP Statistical Review, and, happens to be a better unit of account for cross comparisons in a world increasingly driven by electricity).
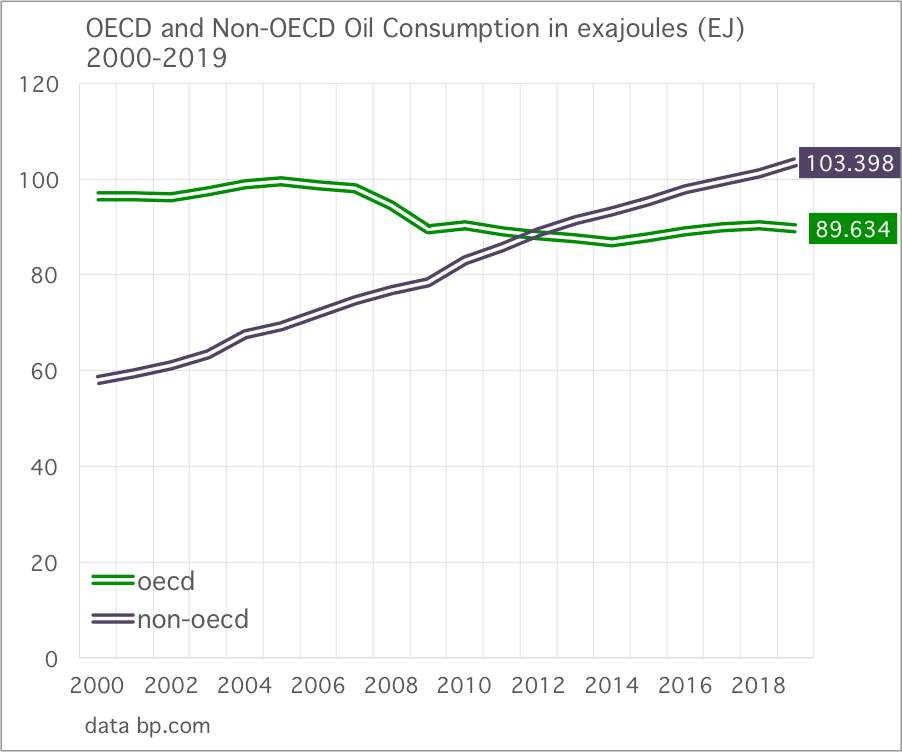
If OECD oil demand does indeed start to decline, there are a couple of lessons to extract from the change in trend. First, in the history of energy use, demand profiles rarely convert quickly from growth to outright decline. A period of stagnant but sturdy demand tends to ensue, often for a long well. Only then does the decline appear. And second, the undermining factors required to force the eventual decline tend to happen in the background, in myriad ways that are hard to see in real time. Finally, often some event like a war or a regime change in economics or technology strikes the decisive blow. When we consider OECD oil demand in 2020, all three lessons are now fully present.
—Gregor Macdonald, editor of The Gregor Letter, and Gregor.us
Photos: 1. Google Maps view of Southern New Jersey. 2. Historic buildings, New Bedford, Massachusetts, 2018, Gregor Macdonald.
The Gregor Letter is a companion to TerraJoule Publishing, whose current release is Oil Fall. If you've not had a chance to read the Oil Fall series, the single title just published in December and you are strongly encouraged to read it. Just hit the picture below.
