
Screening The Forecasts
Monday 18 May 2020


Bike sales are soaring globally as families and commuters look for ways to get outside, while maintaining safe distances. Sales in Britain doubled during the lockdown, and local reporting across the US shows bike inventories at big box retailers are frequently cleaned out. Sales of jet skis, motorcycles, and e-bikes are also reportedly quite strong for similar reasons: summer is coming, and consumers are looking to break free from their multi-month cabin fever. A new cultural refrain is born: Bicycles are the new toilet paper.
United States coal consumption in the electricity sector is forecast to fall so hard this year that hydro and renewables will overtake coal’s contribution to the nation’s power supply. Coal share, according to EIA Washington, is set to collapse from 966.2 TWh last year to 730.3 TWh in 2020. Hydropower, and non-hydropower renewables, are expected to provide 290.5 TWh and 477.9 TWh respectively. Coal’s current downward spiral confirms the antiquated energy source is now in the belly of its market share decline, as the better, faster, and cheaper energy technologies—dominated by wind and solar—take control of growth.
As recently as 2007, coal provided roughly 2000 TWh of power, to the US system. This year, wind and solar will likely move up more than 10% from last year’s 407.3 TWh, to provide roughly 450 TWh. We are much, much closer in time than most anticipated (even renewable experts) to the crossover, when combined wind and solar overtake coal in the US system.

Electricity prices in renewable heavy regions will increasingly go negative this summer, as surplus power crashes into lower demand from the recession. I wrote about this topic in a short note last week, for London based Petroleum Economist. Total power demand in the country will fall by 5% this year, according to the EIA. And in California, curtailments of power are up significantly over last year. Combined with coal’s collapse, the trajectories now coming through answer a common question: does recession accelerate or blunt existing trends? Well, when it comes to electricity, where the new technologies already have a strong market-share foothold, we have our answer: recession is going to accelerate wind and solar’s share, even as total system growth slows down.


Federal Reserve Board Chairman Powell acknowledged in a Sunday interview on 60 Minutes that the recovery would take time—possibly until the end of 2021—and that no sustainable recovery would occur until a COVID vaccine was formulated. The observations are neither controversial or surprising. However, markets are likely to react to the Fed Chair’s willingness to give voice to such outcomes. Powell’s remarks could be interpreted as a pretext for a larger and more sustained help from the central bank. If so, that may extend the current SP500 rally. Alternately, if the market is currently wrong, or even quite wrong, about the pace of a feasible recovery, the remarks could encourage the onset of a recognition phase—a market reckoning with previously unacknowledged realities. With the SP500 trading in a range between 2750 and 2950, one could argue the market is currently discounting a recovery that occurs at a faster pace than trajectories would warrant, given views in the scientific community of the pandemic’s duration.
The Center for Infectious Disease Research and Policy at the University of Minnesota has offered three possible outcome models for the pandemic, over the next 2-3 years. In all scenarios, however, the pandemic presses onward in waves of varying amplitude into 2022. The research was covered by Sharon Begley from STAT, and the Center’s PDF release is here. The authors’ conclusion: “Whichever scenario the pandemic follows (assuming at least some level of ongoing mitigation measures), we must be prepared for at least another 18 to 24 months of significant COVID-19 activity, with hot spots popping up periodically in diverse geographic areas.”
A number of indicators show that global economic activity is starting to slowly crawl upward, from the deep lows of March and April. Samir Madani, from Sweden based Tanker Trackers, has an excellent thread on twitter that collects proxy data for the recovery in mobility. The problem of course is that a tremendous amount of damage has now been done, and specifically, lows in oil demand, manufacturing, and overall consumption were so horrendous that even best case outcomes will likely leave the global economy sitting at levels significantly below the 2019 highs. Something to look out for in the days ahead: in any data series, watch for the tendency of many recoveries to claw back 30-40% of the losses, only to then stall out. This, unfortunately, is the outcome that may define our fate over the next year or two.
The Gregor Letter base case for economic recovery remains unchanged, as the global economy will likely face a three year struggle, with more sustainable hope appearing in 2022. The view incorporates the predictions from scientists, the recovery period typical in previous crises, and the unique characteristics of pandemics and their ability to suppress economic activity over time. One notable concern not expressed in the last letter, when the base case was laid out more fully, is that in the pre-recovery phase of crises human energy itself typically starts to flourish. The depths of recessions, which are bad, counterintuitively happen to be highly conducive to new alliances, new ideas, and new connections from which the next generation of companies are born. What’s particularly worrying about a pandemic, in this regard, is the way it could effectively smother the human tendency to come together in groups to formulate new ideas.
Economic forecasts are understandably all over the map right now, but perhaps there are a few tests or screenings I could offer to gauge forecast quality:
The flu screen: Anyone still under the delusion that COVID-19 is like the flu is not serious, not even in the game. So forecasts that align with a flu-like outcome can also be dismissed with similar dispatch. For example, if you are forecasting that US unemployment will be back below 6% by November, or that earnings for the SP500 will make it back to/near 2019 levels by next year—as the current analysts' consensus foresees—these, frankly, sound very much like a flu forecast, in which a bad case of the flu comes through like a hurricane, and then dissipates.
The kakistocracy screen: The United States is currently under control of one of the most inept and dishonest administrations in history, and saying so is (incredibly) no longer hyperbolic or partisan. If a worse response to the global pandemic was achievable, it’s hard to imagine how much different it would be—from the record set in place so far. Accordingly, forecasts that continually assume a competent and rational response from this point forward are deeply flawed. Readers familiar with the Gell-Mann amnesia effect will readily understand the point being made. (If the Gell-Mann effect doesn’t work for you, please see the Just World fallacy).
The ahistorical recession screen: Recessions that kick off from severe shocks and panics tend to take a long time to heal. A very long time. The two components at play appear to be the severity of damage done to demand, business finances, and networks during the shock phase, and then the fear and savings behavior that dominate for both corporations and individuals in the following years. So any forecast that calls for a V recovery is already in deep trouble from the get-go, and is quite ahistorical, as the damage done this year will take years to repair.
Readers may recall, for example, how we waited much of last decade for jobs to regain their previous highs. Many tracked that painfully slow motion at Calculated Risk, and the blog’s “Scariest Jobs Chart Ever.” But if the previous recession warranted such title, what should we call the chart for the current recession?

Half of laid-off Americans are barely getting by, and half of US small businesses don’t have enough cash to last another month. The data points come from a recent survey by the Federal Reserve, as reported this week in the Washington Post.
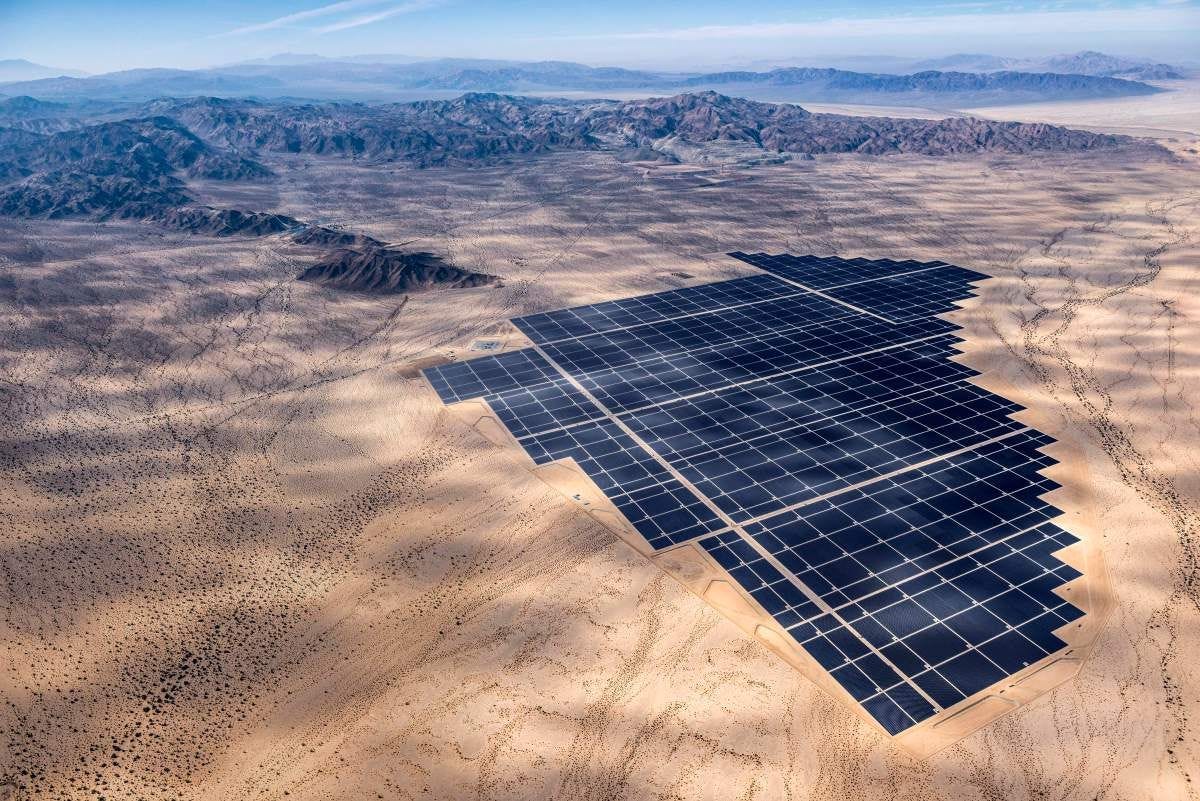
The largest solar project in the US won final approval and will now go forward at a location 25 miles northeast of Las Vegas, in the Nevada desert. Gemini is expected to top out in 2022 at 690 MW, and will be paired with a 380 MW battery. Built on federal land, a portion of the revenue stream will also accrue to the US government. The Bureau of Land Management order can be read in full, here.
Author and energy analyst Ramez Naam has released his latest solar forecast. The edge that Ramez brings to this subject is a projection that’s led by the learning rate. The advantage here is that, instead of trying to forecast policy (which is a legitimate way to go about the task), or the rate at which various countries are adopting solar in conjunction with other energy solutions, Naam’s forecast highlights the persuasive reality of price, and, the rate at which the technology is likely to push through price levels.
There’s both an elegance to this approach, and, a rationale—one that’s backed up by observation. Indeed, much of the reporting I did last year focused on the domino effect among US utilities who, running sophisticated cost models, came to the same conclusion: it was now becoming imperative to replace legacy coal and gas assets with wind, solar and storage. Please see the big thread:


—Gregor Macdonald, editor of The Gregor Letter, and Gregor.us
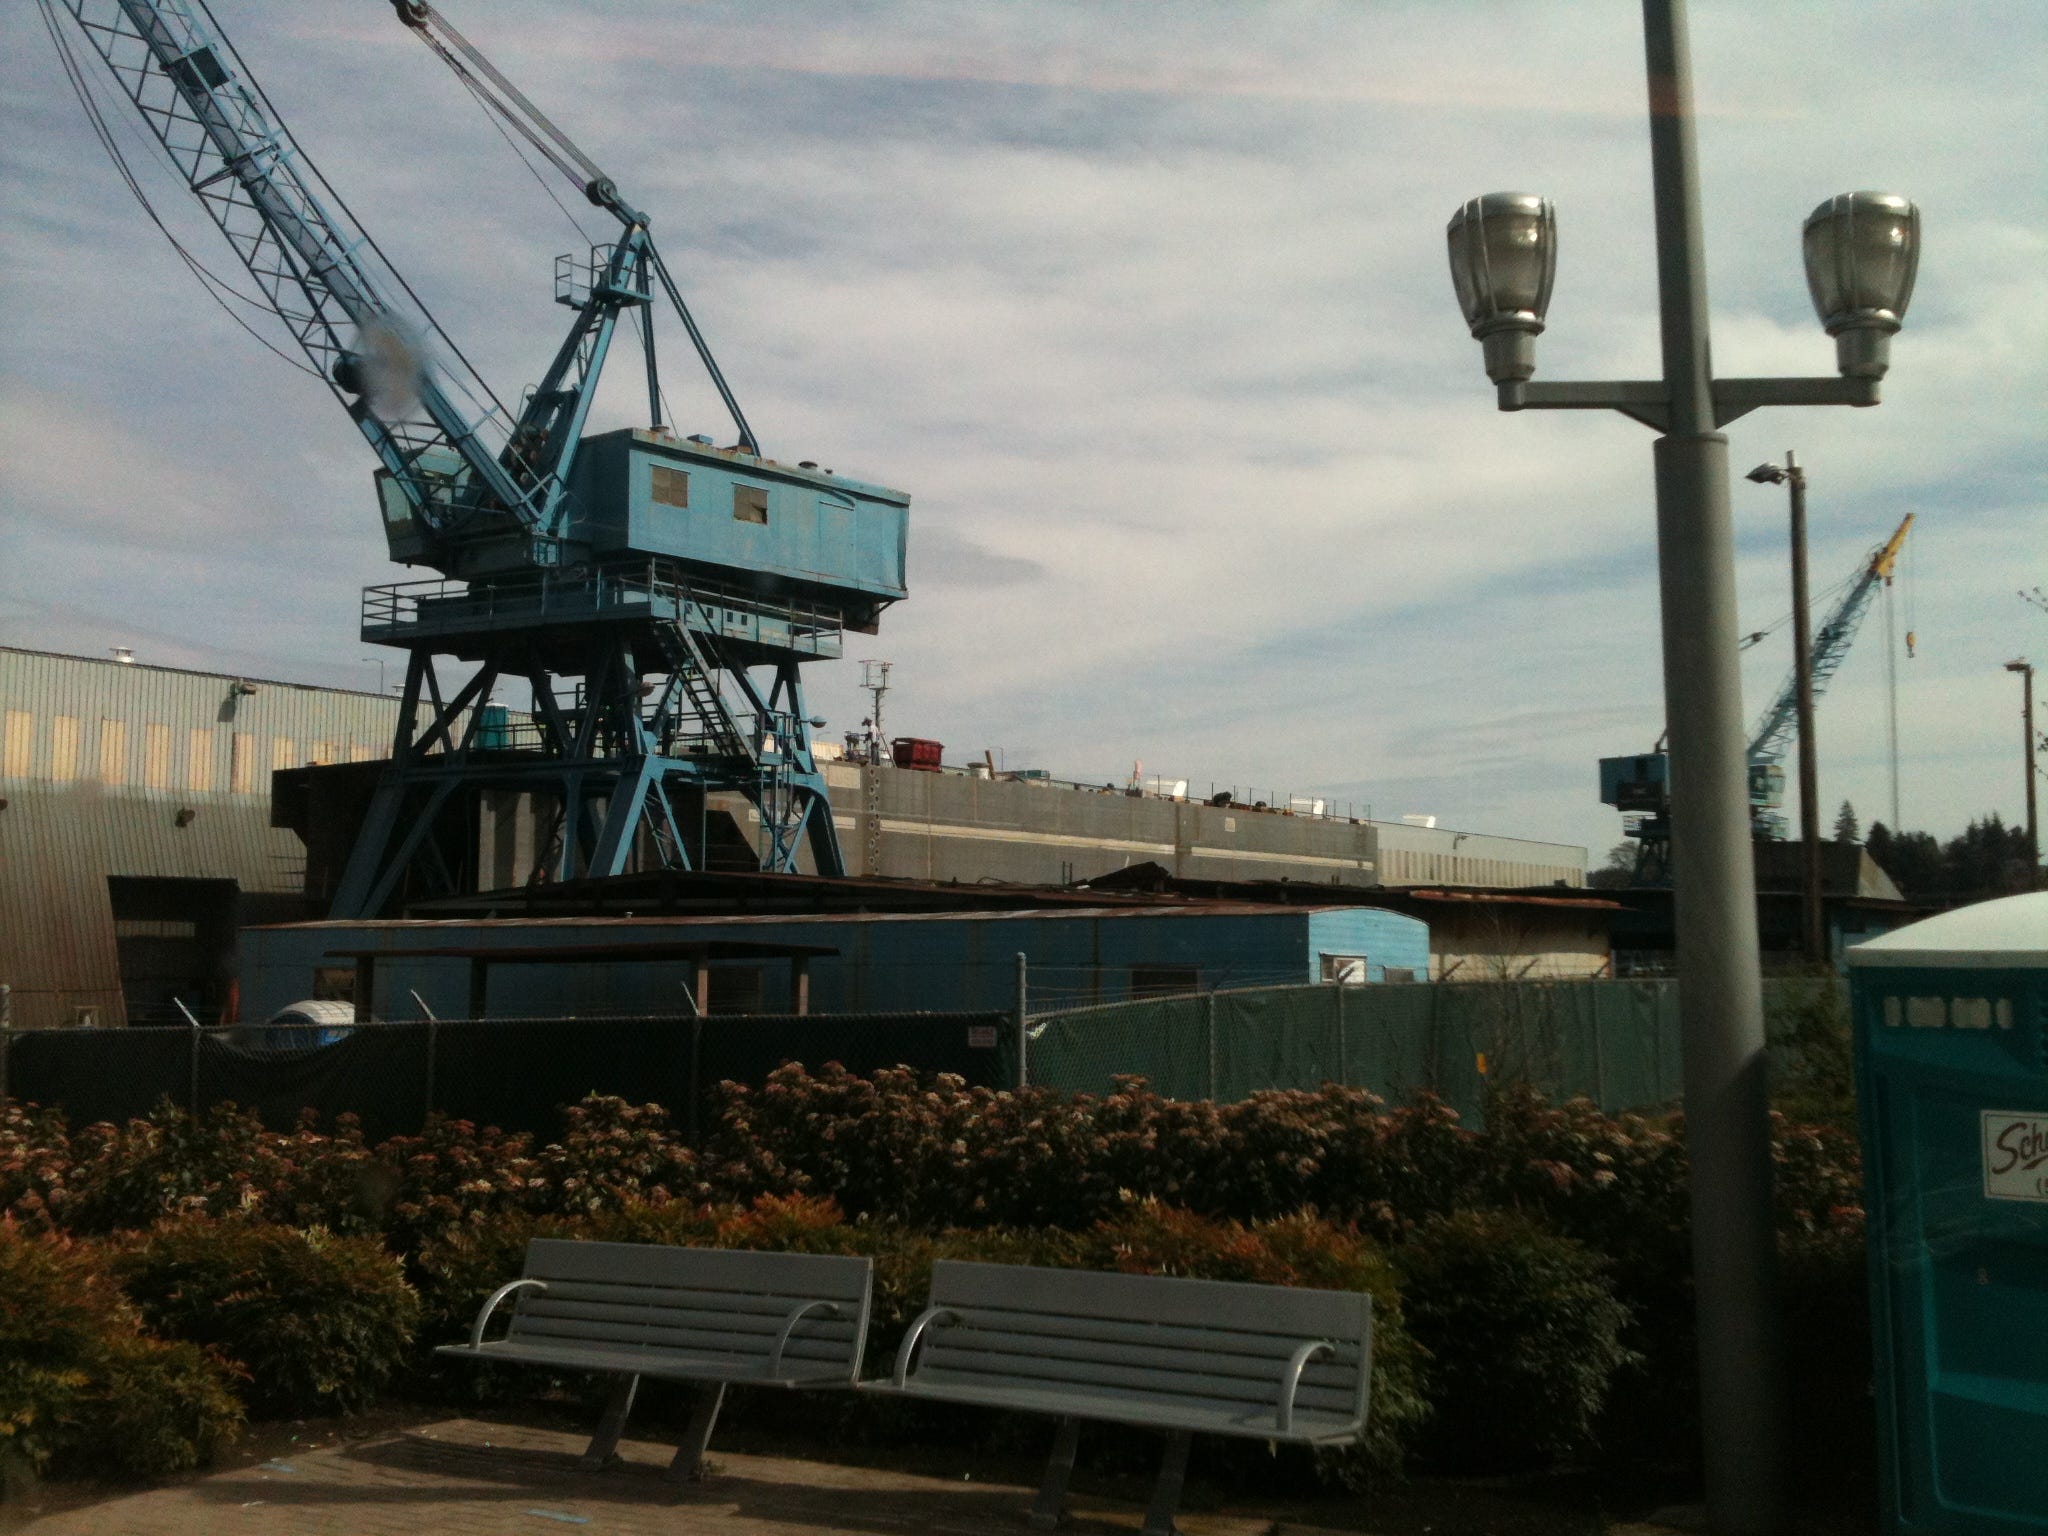
Photos: 1. Canyon Grail all-road bike, Tilikum Bridge, Portland, Oregon, 2018, Gregor Macdonald. 2. Shipyards of Zidell Marine and Barge, Portland, Oregon, 2015, Gregor Macdonald. 3. Western US solar array, source unknown.
The Gregor Letter is a companion to TerraJoule Publishing, whose current release is Oil Fall. If you've not had a chance to read the Oil Fall series, the single title just published in December and you are strongly encouraged to read it. Just hit the picture below.
