
Slipping into Darkness
Monday 18 August 2025


The forward progress of emissions reductions made by the US in recent years is coming to a close. Natural gas and especially coal consumption have surged higher this year and that’s well before new policies, hostile to renewables and friendly to fossil fuels, have come to full realization. Through the first four months of 2025, emissions from US coal have risen by 19%, and natural gas emissions have risen by 3.4%. Petroleum emissions are firm, up 1.65%. Total U.S. emissions are up 4.6% as a result. While there’s plenty of time left in the year to see these growth indicators retreat some, we must remember that the relaxation of emissions rules across the U.S. economy has not yet fully rolled out, and the major curbs on renewable deployment are still to come.
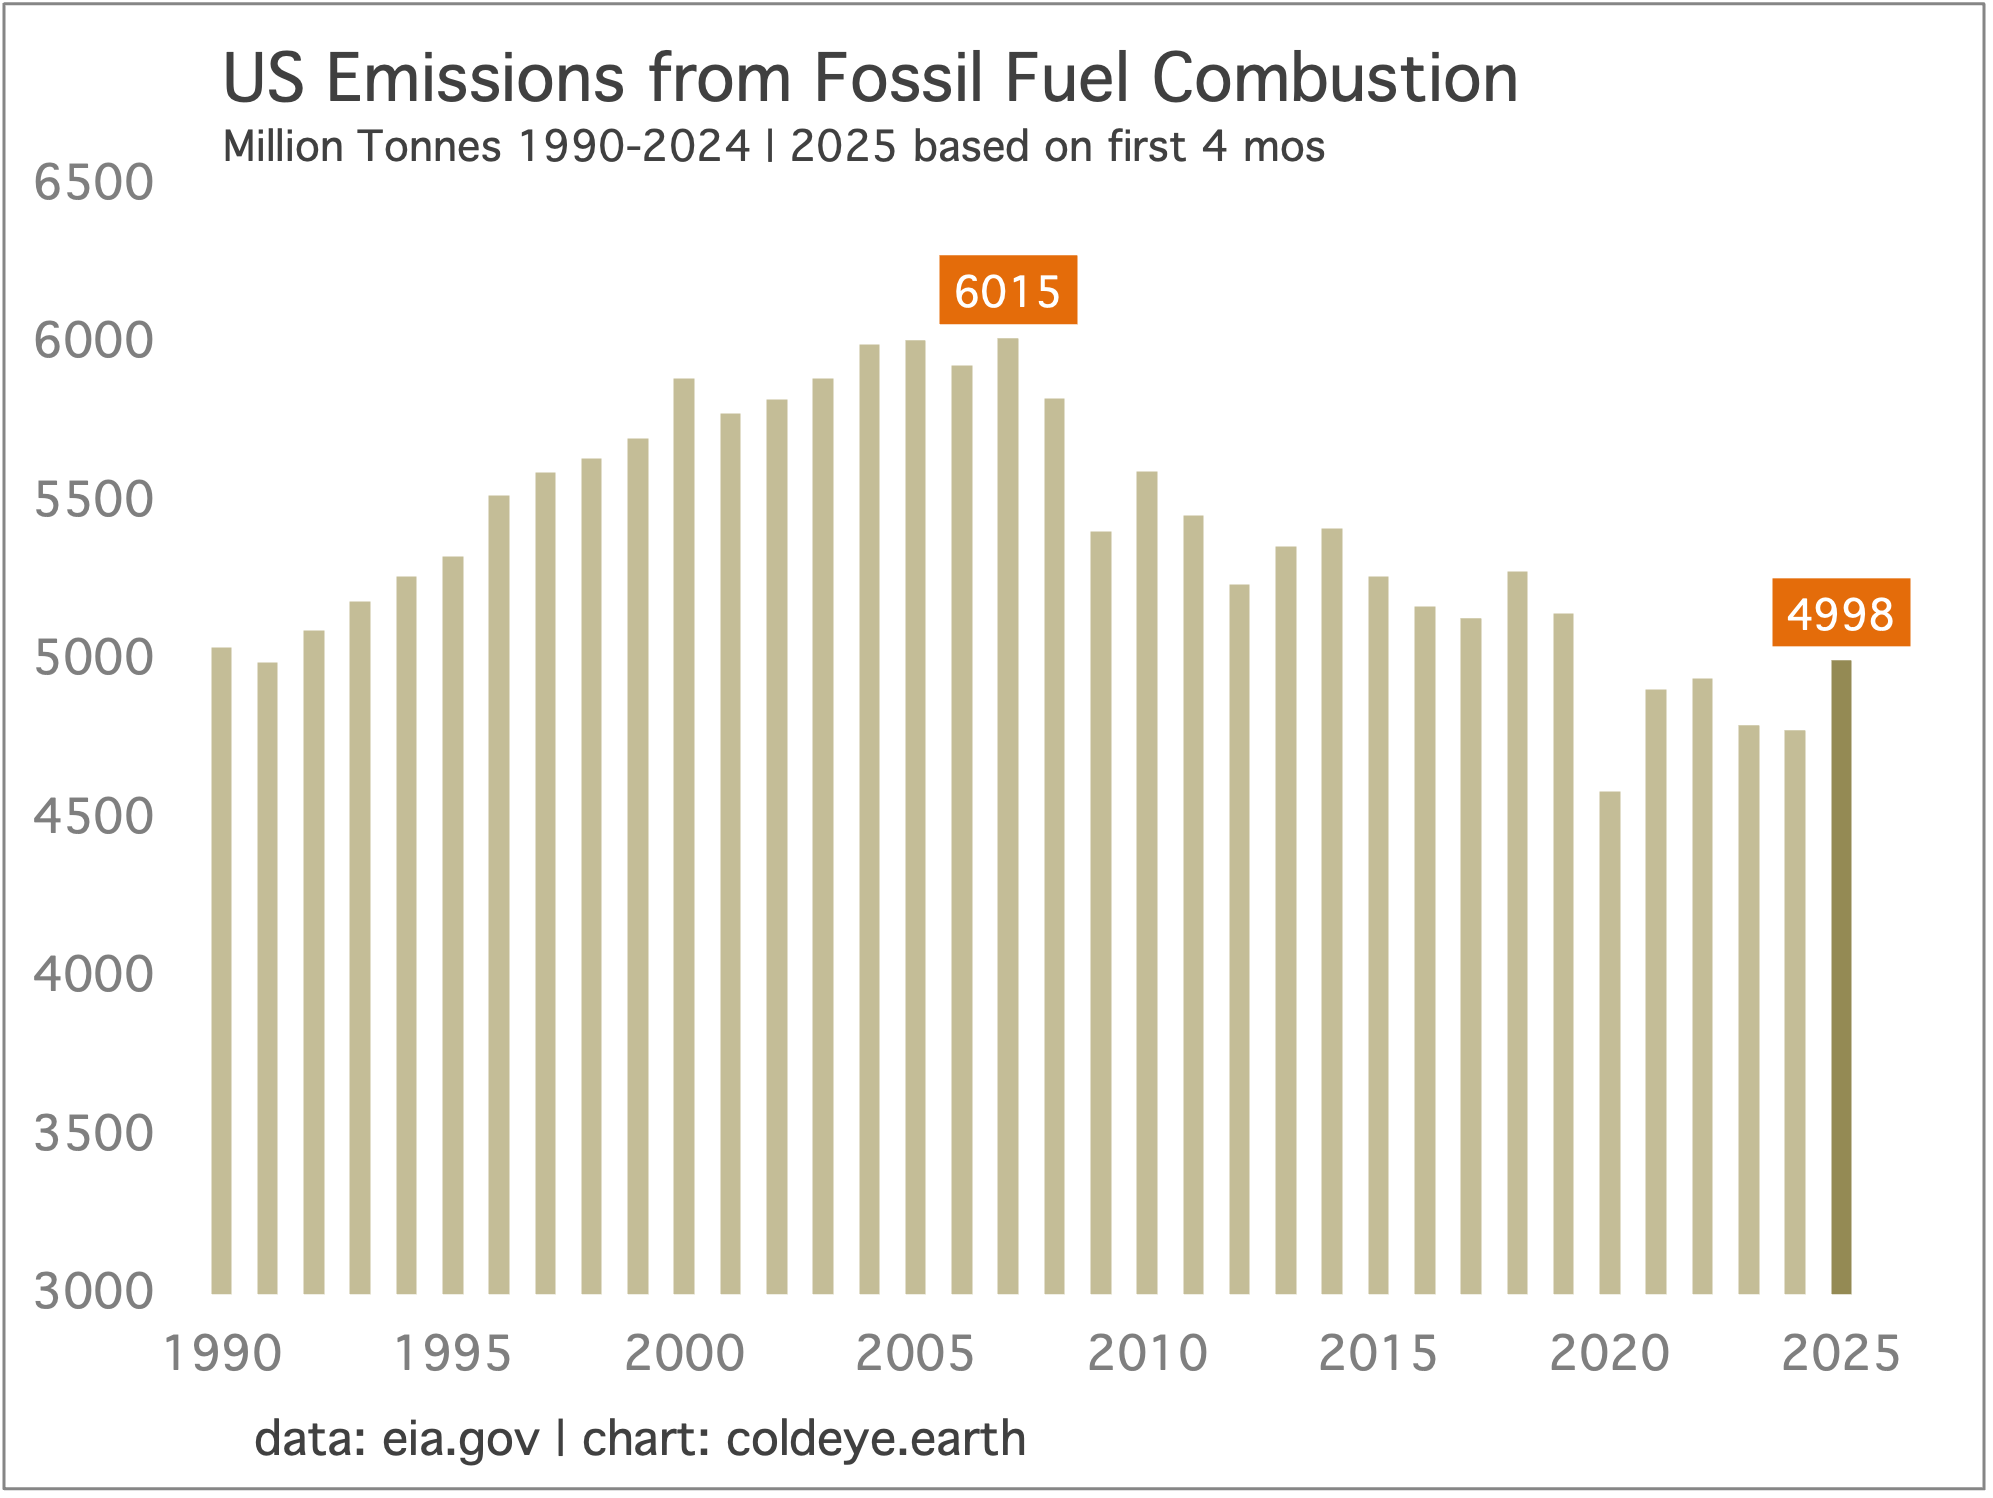
Because economic growth is more controlling of emissions trajectories than the deployment of renewables, the most effective challenge to the new array of fossil-fuel-friendly policies in the U.S. would be a recession. You only need glance at the previous chart to see these effects: most recently in 2020, but also in 2009. A recession in the U.S. this year would absolutely change the current path of emissions. A bad recession that pressed onward into next year would likely see 2026 emissions returning to last year’s levels, if not lower. Given the current set of economic and trade policies—upward pressure on prices of goods and services, and downward pressure on employment due to slower economic growth and trade—we may indeed get a recession before the current presidential term is over.

Recent economic data from the U.S. has been poor, reflecting renewed weakness in the labor market, and more recently, indications of rising inflation. The month of August began with a disruptive jobs report that showed fairly massive downward revisions to previous data, and thus raised the alarm bells about recession. Interestingly, the FOMC met only two days prior to the job news, and Fed Chair Powell in his press conference remarks remained focused on inflation.
But it wasn’t long before Wall Street learned that Powell’s focus was justified. The Producer Price Index (PPI) was pretty ugly, and converted quickly to a strong retort of the emerging view that the tariffs were not inflationary. Barron’s, the stalwart publication of the financial sector, did not mince words: Tariffs Are Starting to Cause Inflation. Just Look at This Week’s Data.
Unfortunately, there is no landscape the stock market hates more than the pairing of slow growth and rising prices. While modern economies are greatly insulated from stagflation due to technology, free trade, and demographics, if the U.S. lapses into such conditions for a while they must be regarded as entirely man-made—an own goal driven by a zany, economically illiterate White House. Worse, two-hundred years of progress in economic theory and practice already foretold such an outcome. From the April issue of Cold Eye Earth, Ricardo in Reverse:
The collective actions of the administration—from the Council of Economic Advisors to the President, from the Republican Congress to the comically inept figures of Lutnick, Navarro, and Greer—reveals they have no understanding of the well established dynamics of trade that were advanced by the British economist David Ricardo, over 200 years ago. The President’s obsession in particular not just with tariffs, but with eliminating trade deficits, poignantly also recalls the mercantilist era, dominant when Ricardo first launched his ideas. Thus, after having lived in Ricardo’s world for a couple of centuries, the crackpots and ideologues of Team Trump have attempted to put Ricardo in reverse. But it cannot work, will not work. Markets, historians, economists, trade experts, corporations, and other countries all have the same answer to this doomed attempt to flout the laws of trade: two thumbs down.
Now that the stagflationary data is starting to flow through, it’s possible the White House panics and reverses course. But they would have to act soon. While the U.S. midterm elections take place in November of next year, the campaigns for those elections will begin this Autumn. That timeframe is very tight to undo policy, and shift the narrative back in their favor. And just to say: that the administration is playing games with the inflation data, or the jobs data, is your confirmation the White House now fears and understands that things are not going their way.
• Further reading: Donald Trump’s awful trade policy will outlast him. He thinks America is winning. It is not.
U.S. electricity demand is growing strongly this year, indicating 3.6% growth in the first five months of 2025. The context is that global electricity demand is growing at above trend rates right now, and will continue to do so through the end of the decade, according to forecasts from the IEA. Quite obviously, for that growth to come true, the U.S. must be growing strongly too along with China, Europe, and the rest of the non-OECD. According to the IEA, we’re in the middle of an intense growth phase, in which global power will grow at 3.50% or above last year, this year, and in 2026.
Here in the U.S. let’s use the usual chart that does double-duty: indicating power system growth overall, and the contribution from wind and solar. As you toggle over the interactive elements, notice that U.S. wind and solar are still not quite covering all marginal growth, as all sources ex wind+solar (gray bars) are either holding steady or growing a little. Culprits? Natural gas, and so far this year, coal.
Do you see how sources ex wind+solar were not just countered, but actually forced into decline from 2010 through 2019? And then do you notice how these sources were pressed downward towards 3500 TWh coming into the 2020-2025 period, but were pushed no further? And do you see how they are slightly growing again? That’s a perfect portrait of the additive model of energy transition. When the overall system is growing slowly (or not at all), and when there’s a wave of power plant retirements (as there were in the U.S. in the 2010-2020 period—mostly coal), then new and fast growing wind and solar can not only cover all marginal growth, but can actually start to eat into the fossil fuel base. The most powerful factor in this “eating into” process being the lack of total system demand growth.
But then consider what happens when demand growth really gets going again. Despite the clearly increasing volume of new wind+solar generation coming onto the grid, it’s still not enough to fully suppress the growth of other sources in power.
Here is a test of your intuitions: if the system share of generation from combined wind and solar positively advances from 17% to 19% in a single year, would it still be possible for sources ex wind+solar to grow, in that same year? How you will answer this question depends on whether you work alot with data series like this, and in particular, if you study the growth of large systems. Cold Eye Earth observes that many people mistakenly believe they have a solid handle on energy transition and its contours.

Expecting China’s emissions to peak anytime soon might be analogous to expecting U.S. emissions to have peaked in the early 1980s. This is roughly the era when the U.S. started shedding industrial capacity more quickly, but then leaned so much harder into becoming a consumer-based economy that its emissions kept rising, mostly on the back of oil consumption. U.S emissions finally peaked much later, not until this century, during the 2005-2007 period. The lesson: an industrial base will undoubtedly add to the stock of your emissions, and shrinking that base will drive them down. But higher levels of wealth can drive domestic consumption so high that your CO2 output makes up for the erosion in your industrial base.
Between the lines, you can discern that some observers, hellbent on calling peak emissions, are partially using this model to anticipate what comes next in China. But, somehow in their telling, China’s industrial base relaxes; the Chinese consumer doesn’t press onward to higher levels of demand; and growth of clean energy takes care of the rest. If this is your model, it’s not going to work out anytime soon.
A series of very helpful historical charts appeared this week in a longform story on China’s economy from the Australian Broadcasting Corporation (ABC) despite the article itself, which is naively credulous in its conclusions. Let’s grab the most important chart, and make some very simple, uncomplicated points:
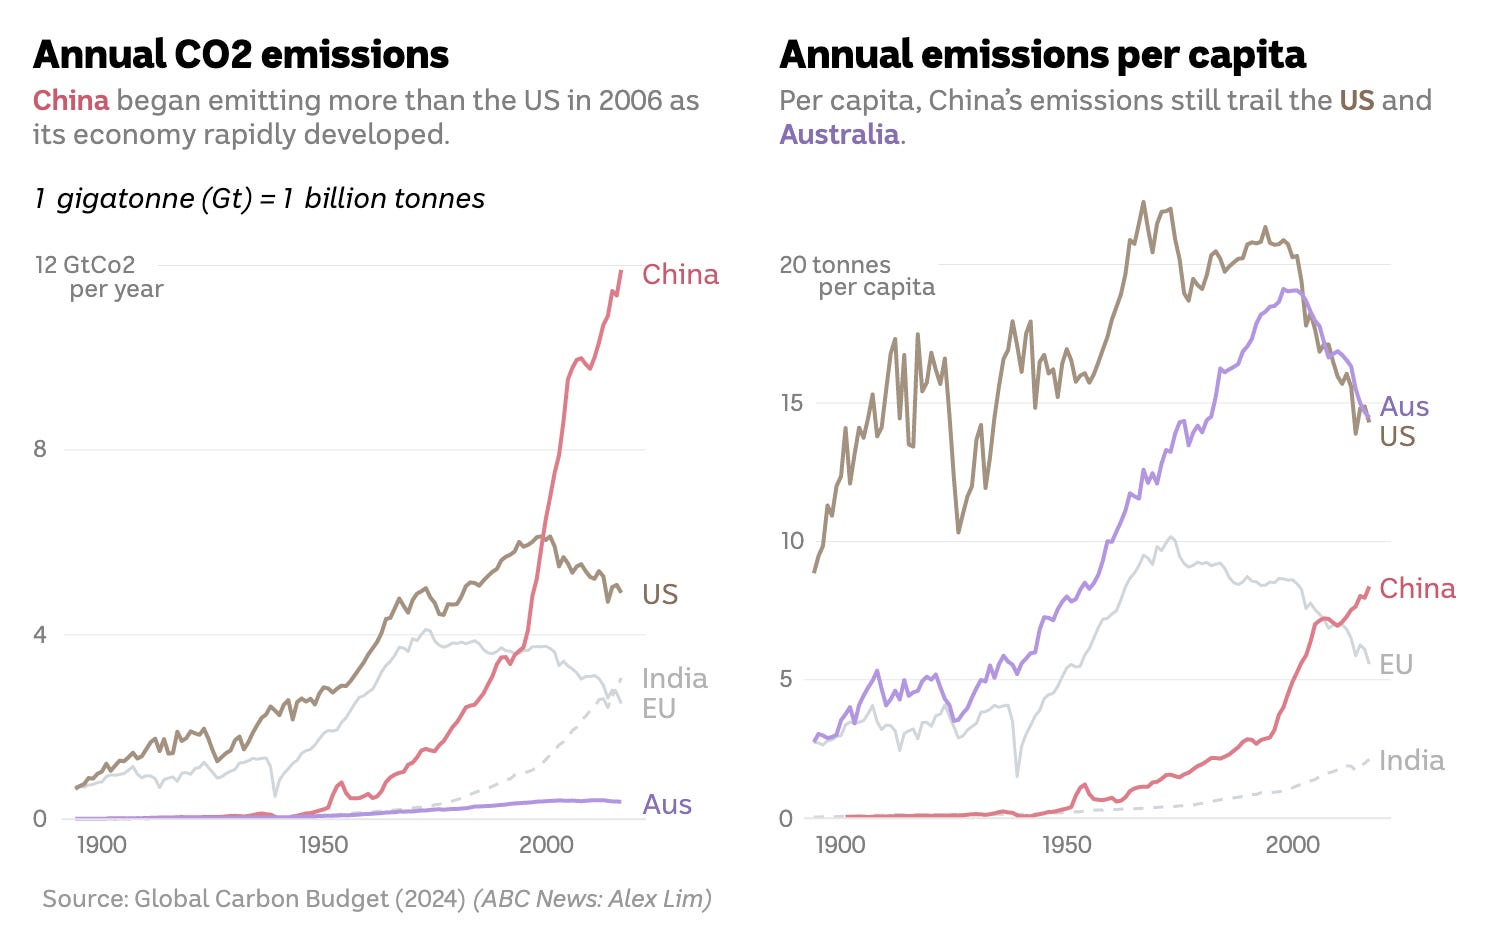
• When did emissions in the U.S. and the EU start to fall? Roughly, when China’s share of global manufacturing began its most recent, meteoric ascent—in the 1990s. Yes, there have been gains in efficiency, and not every unit of lost manufacturing activity in the OECD showed up in China. But the basic equation is solid: emissions followed the migration of industrial production to China.
• How do we know that there’s ample room for China’s population to become super consumers, even if the growth of their industrial base relaxes? Because emissions per capita have only just passed the EU, and would still have a long way to go to reach U.S. levels. The per capita figures also wipe away any confusion about the nature of China’s emissions output: it’s directly the result of taking global manufacturing share.
A number of good things will still happen here, despite the rather foreboding prospect of future Chinese consumption. First, China will eventually halt all marginal growth in fossil fuels in its power system. In the additive model of energy transition, technologies like wind and solar are indeed fated to cover all the growth in a sector like electricity. But also according to the additive model, it could take a very long time before fossil fuels actually retreat in power. There is also no question that China’s industrial base, its built environment, and its transportation systems will become more efficient. So there are harder-to-account-for energy savings that will unfurl as the years pass by. In other words, it will take less energy in the future to run the same economy as China runs today. All good things, to be sure. But certainly not a recipe at all for peak emissions from China.
Prediction: China peak emissions callers will eventually throw in the towel.
Further reading: In sudden shift, American emissions rise as China’s falls.
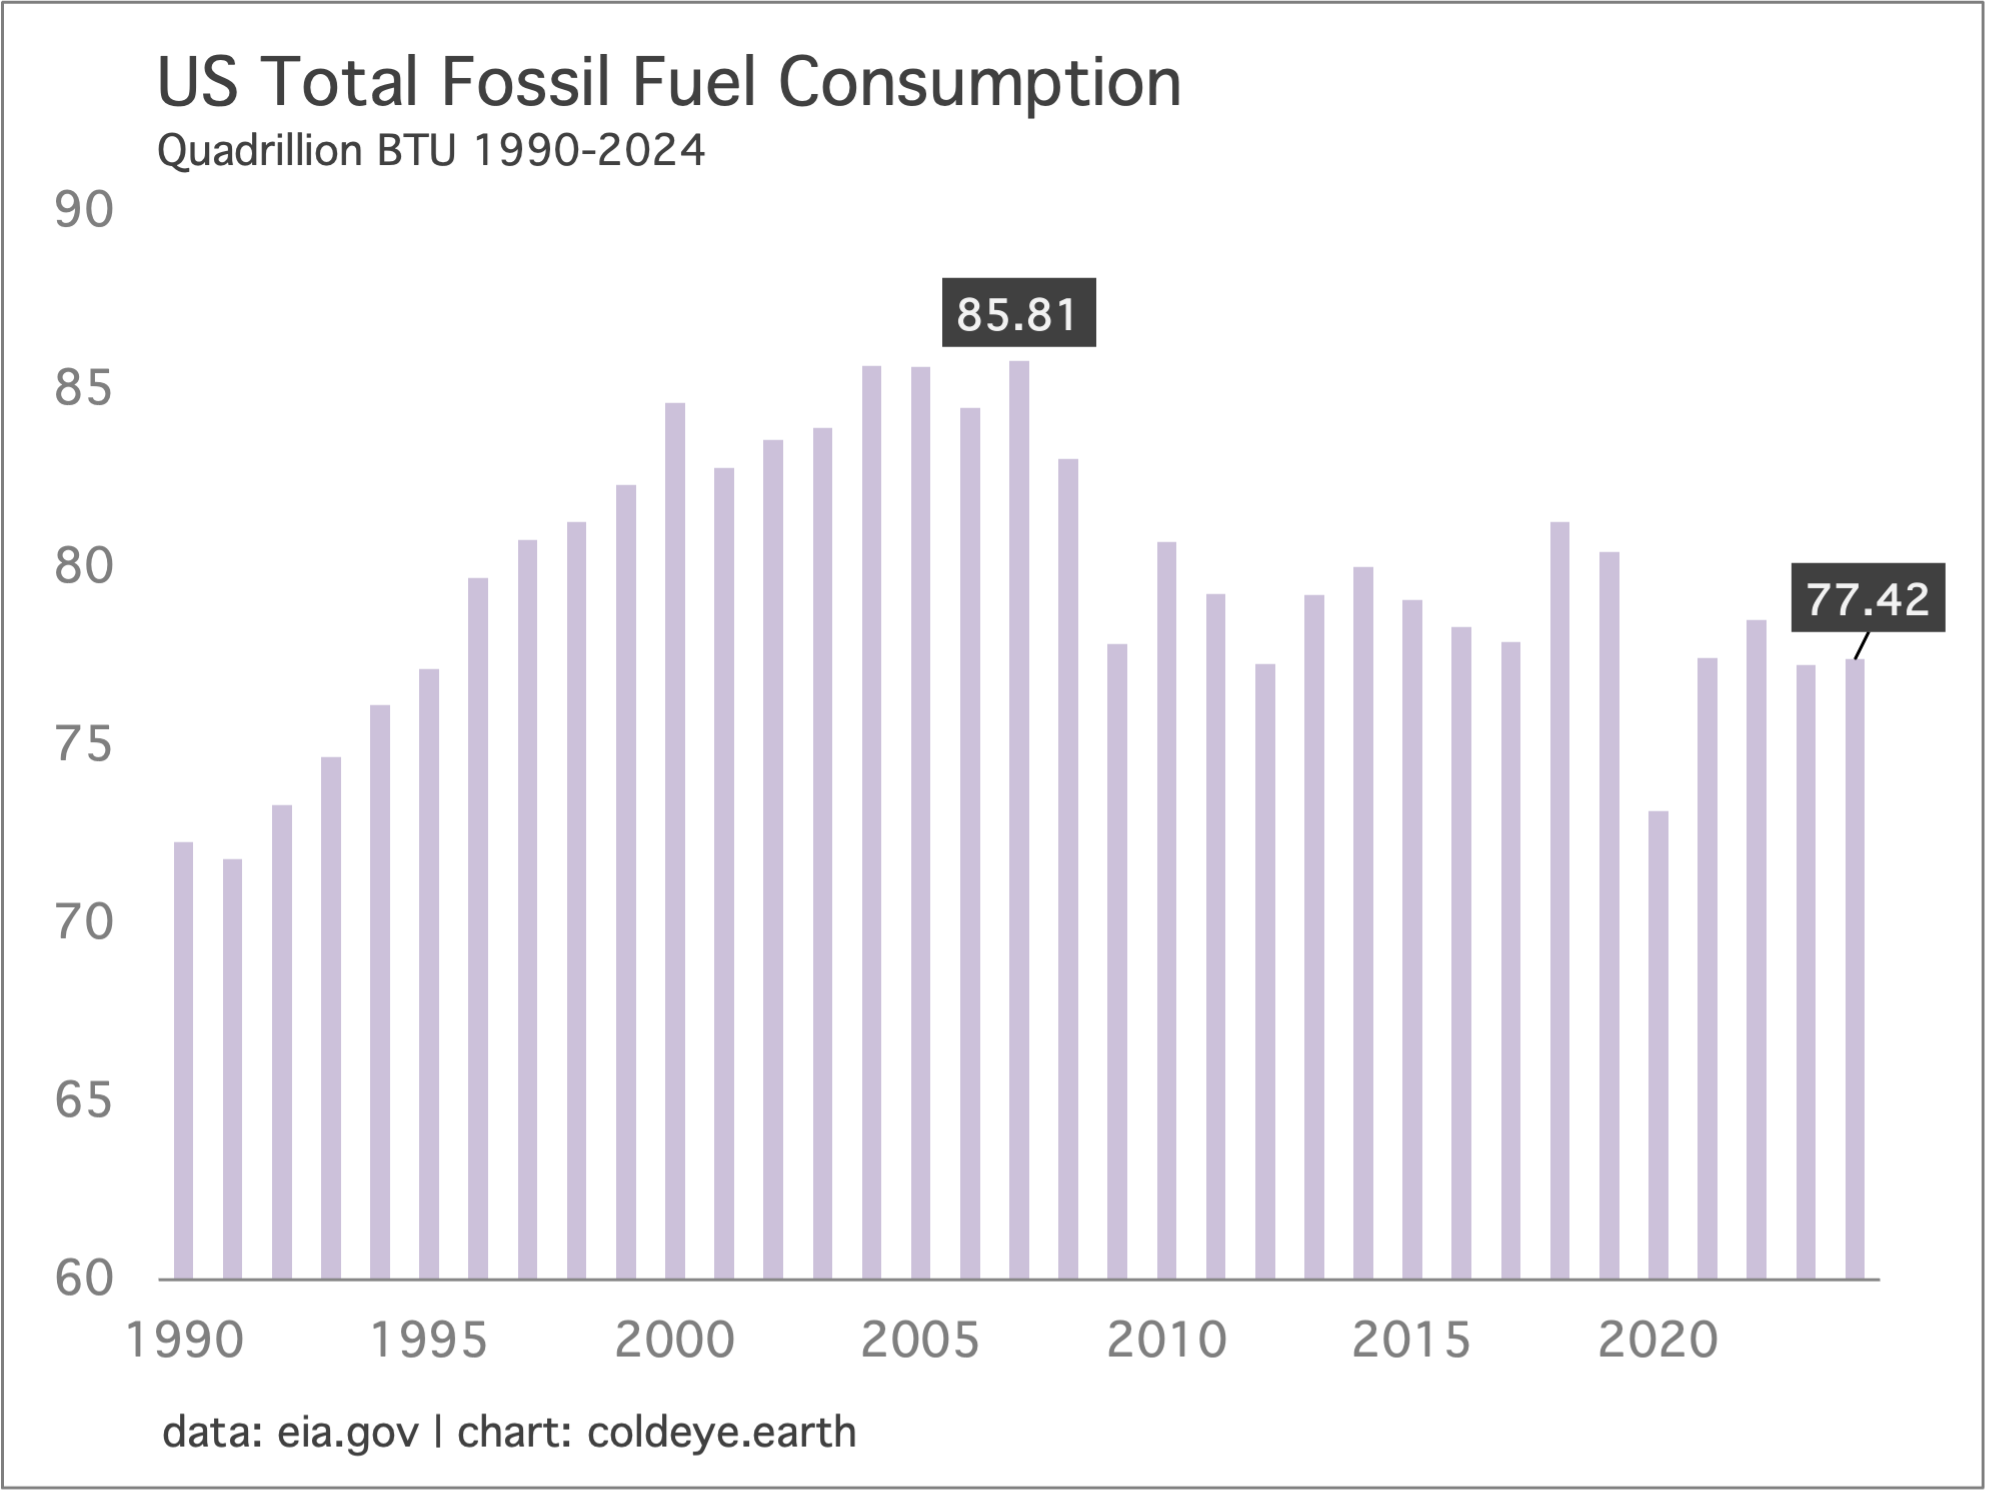
U.S. total consumption of fossil fuels is no longer falling. Importantly, it should be clarified this pattern was already emerging before Trump took office. Another reminder: Trump has only been in office for 8 months. So, the vast majority of changes to fossil fuel use and decarbonization are yet to come. In the chart below, which runs through the end of calendar year 2024, you can see that the trend of lower fossil fuel consumption came to an end around 2018-2019, and has since started to flatten out. There are myriad cross-currents, explanations, policies that can be considered here, but the simplest one is best: apart from the deployment of wind and solar in electricity, the U.S. never had nor does it have any notable plan to reduce emissions outside of the power sector. Cold Eye Earth warned about this approach multiple times, explaining in particular that should something go wrong with power sector decarbonization, the country would have no other plan to reduce emissions except long-term, aspirational plans that wouldn’t land until well into next decade. And thus, here we are.
—Gregor Macdonald