Targets Missed
Monday 8 January 2024
There is no prospect that global emissions are set to fall anytime soon, and accepting this fact is the best overall approach to solving the problem. Growth of global clean energy meanwhile, solar especially, is exploding higher. This is everywhere and at all times very good news, but it’s still not enough. The hard wall of emissions is composed of plain, old economic growth trudging forward at a couple of percentage points per year. Real talk: a very large system growing slowly will reliably overwhelm, and snuff out, the effect of a small thing growing quickly. As a result, the thick layer of global fossil fuel dependency no longer has to grow at all, in order to stay in place stubbornly for years to come. That one truth can be easily observed anytime you turn the page in an Excel spreadsheet of our energy system’s evolution.
Futurists who are light on history typically imagine that energy transition is perhaps like the cohort by cohort digital replacement of old rotary telephones, with the latter piling up at landfills until a photographer comes along to take a photo that, in satisfying overtones, screams progress. But no, energy transition is not like that at all. Rather, it’s more like a fast adoption of digital phones in a world where all the rotary handsets are still in use, and even where jettisoned, wind up being put back into service somewhere else. Telling ourselves we will transform the system solely with the new technology, while doing nothing about the old, is an act of self-deception.
One of the more fertile domains where this mode of thinking dominates is in the United States, where the effective, decade-long killing of coal initially yielded encouraging declines in fossil fuel consumption, and emissions. Eventually, though, the cake started to show through the icing. US emissions declines have now entirely lost momentum as the growth of natural gas reaches a torrential pace, and transportation emissions hang on to a twenty year flatline. When killing coal is your only accomplishment, well, it shows.
Total US fossil fuel consumption was in a nice downtrend into 2017, then broke up in 2018. Cold Eye Earth is hardly stating anything novel here: numerous climate journalists and analysts began to warn, starting five years ago, that the easy progress through coal closures would eventually come to an end. And so, it has. Total fossil fuel consumption in the US has merely stepped down to a lower plateau, between 75-80 quadrillion BTU.
It must also be said that despite the well designed features of the Inflation Reduction Act, and other associated programs, the system these target most is electricity. In other words, we trotted out legislation that would affect most the system already in transition, the power sector, while leaving transportation unaffected. Indeed, it can now be said that outside of EV adoption, the US literally has no policy plans in place to lower emissions from transportation. If you want to celebrate that US oil consumption hasn’t grown in two decades, go ahead. You’ll soon receive an answer back: oil consumption hasn’t fallen much either.
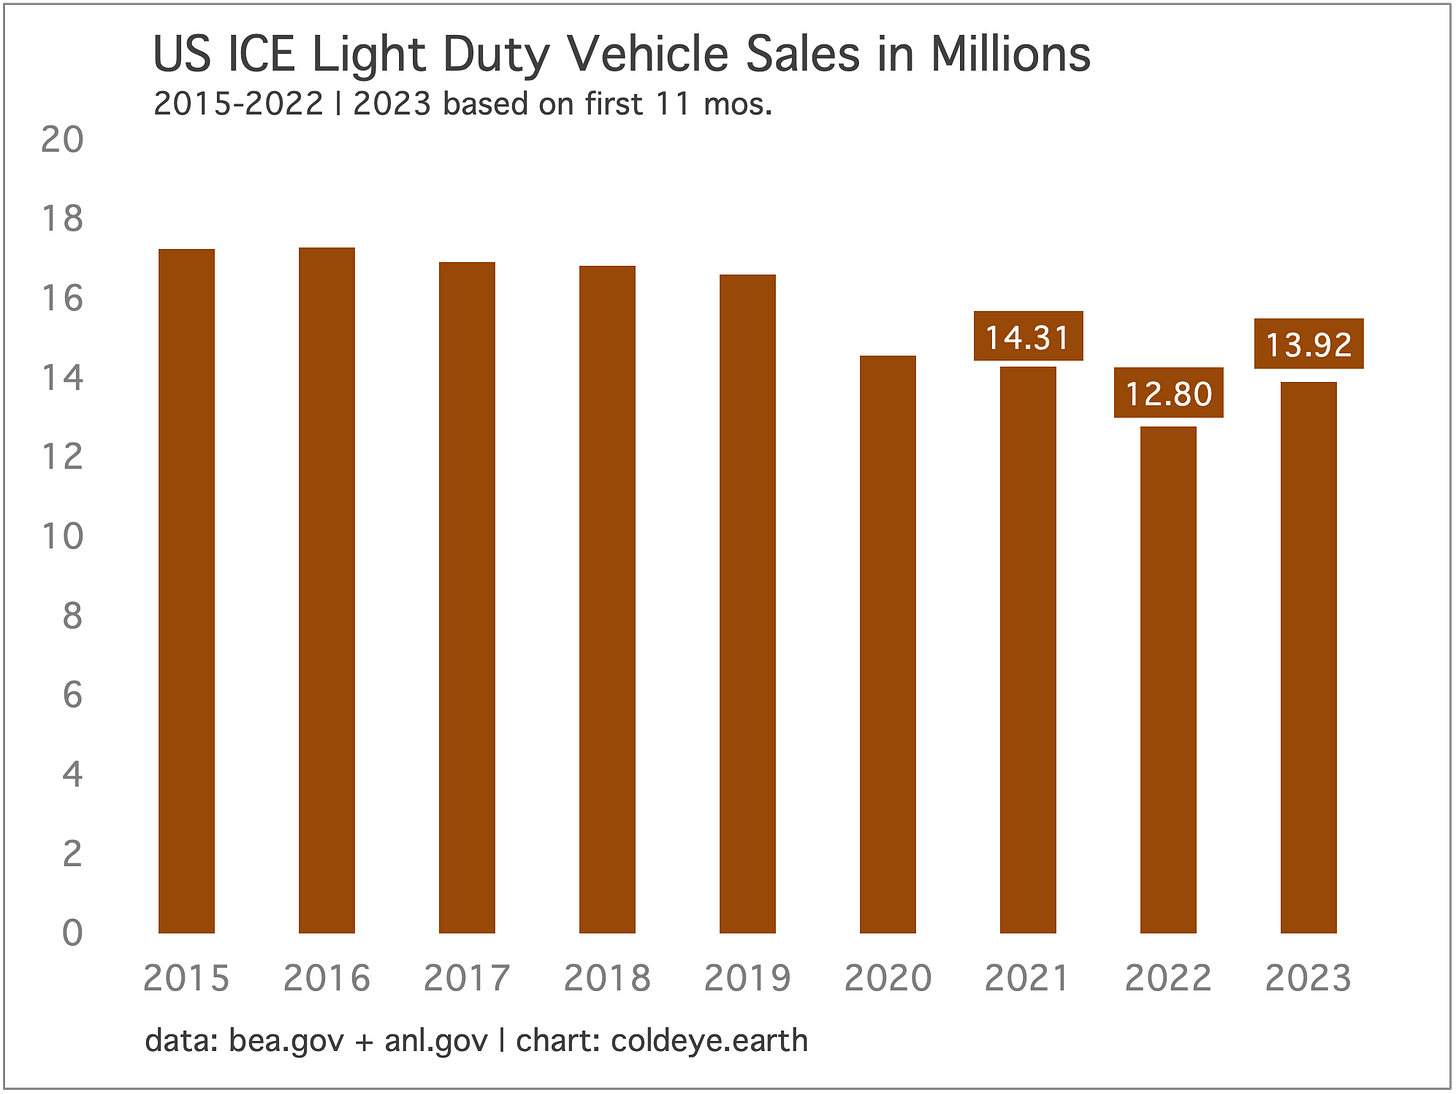
Sales of internal combustion vehicles rose in the United States in 2023, the first time in seven years. That’s not a happy statistic, is it? To be fair, this bounce could plausibly be characterized as a baseline effect, lifting off an abnormally low year for ICE sales in 2022. That said, seeing ICE sales advance by 1.1 million units YOY is not encouraging, as we should by now be deep into an uninterrupted, downward trend.
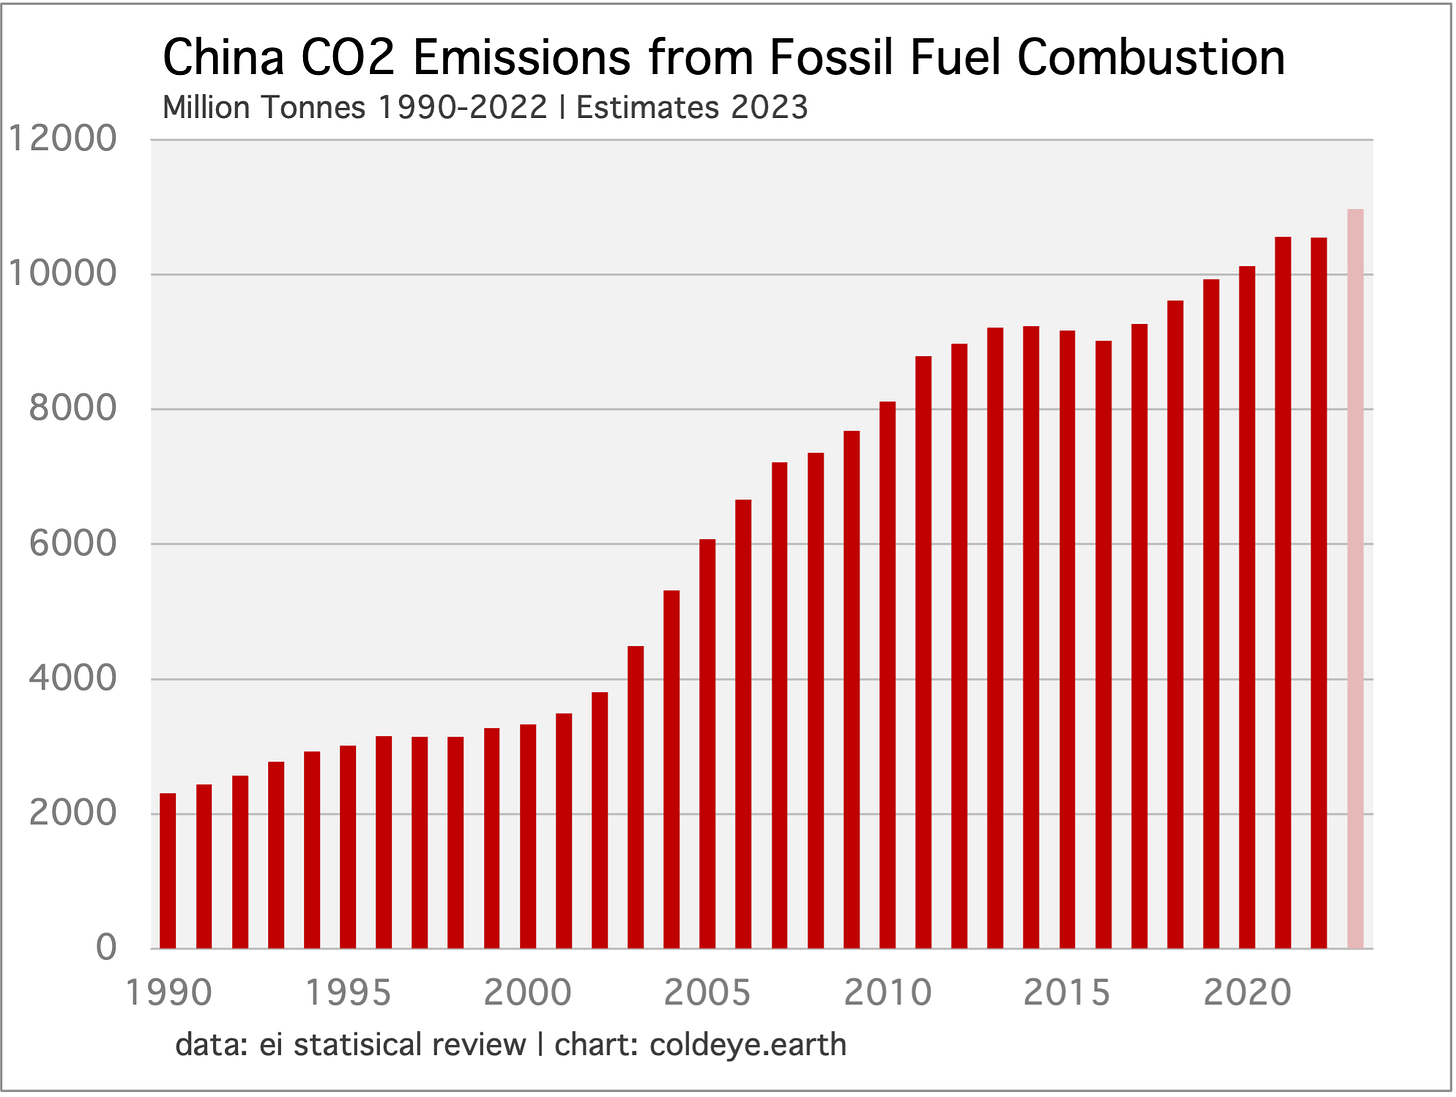
Until fossil fuel consumption goes into sustained decline, yearly oscillations must be regarded as a continuation of the peak. A good example is China, where demographics, economic weakness, a revolutionary buildout of clean energy and rapid EV adoption have now combined to slow emissions growth. According to analysis from Carbon Brief, China emissions may actually fall next year. Meh. Unfortunately, while this confirms that China’s fossil fuel consumption is likely coming into the peak zone, this provides no useful signal for when sustained declines may arrive, and in the near term does not portend declines. Indeed, the Carbon Brief article unhelpfully dangles the phrase “structural decline.”
If coal interests fail to stall the expansion of China’s wind and solar capacity, then low-carbon energy growth would be sufficient to cover rising electricity demand beyond 2024. This would push fossil fuel use – and emissions – into an extended period of structural decline.
Well, we have learned over the past decade that coal is a special kind of problem in China (and across Asia) because overcapacity of coal-fired power generation cuts two different patterns, making analysis difficult. On one hand, as spare capacity grows, it persuades us to conclude that coal growth is over. On the other hand, spare capacity lies, like a lion, silently in the tall grass and then springs forward during spikes in industrial output or temperature volatility. The climate scientist Glen Peters at CICERO in Oslo warned about this effect a decade ago. Until coal capacity is literally deconstructed, therefore, it’s a systemic call option; and we saw that in recent years during Russia’s invasion of Ukraine, which jumbled up LNG supply, thus forcing countries to increase their coal power. More broadly, this is why the global coal consumption peak, which initially occurred around 2013/2014 and converted into seven years of gentle decline, wound up failing as a peak when consumption started to rise again in 2021, and matched the old high in 2022.
If China emissions do fall in 2024, they will of course be “falling” from a new all time high set this year, when emissions are estimated to have risen by about 4.00%. Quite obviously therefore it’s pointless to start making claims about sustained declines. Indeed, similar prospective claims were made last decade, when emission flattened out during the 2012-2016 period.
Readers interested in this topic are encouraged to examine the energy history of the United States after World War II, when the US began a lengthy transition towards a consumption based economy, and slowly pared back industrialism. For those thinking China is about to follow that same path, the US example shows there’s nothing about that long pivot that portends lower overall energy consumption.
We continue to see forecasts that emissions in global power are going to start declining this decade but these forecasts are wrong. Are power sector emissions set to start flatlining? Yes, thankfully. But a plateau is a plateau, and nothing more. To understand why it’s so hard to produce declines, let’s consider the example of 2023, a year in which deployment of new wind and solar went supernova.
According to estimates, the world is on course to have deployed about 400 GW of new solar capacity, and 125 GW of new wind power capacity in 2023. Together, these would have started generating roughly 750 TWh of new, clean electricity globally last year. Now comes the hard truth. Total global powergen stood at 29,165 TWh in 2022. If total demand advances at the average trailing rate of 2.68% (2010-2022), total system growth will have grown by 781 TWh last year. The good news: wind and solar will come close to offsetting nearly 100% of that growth. Fantastic. That’s exactly what we want to see, and why it’s justified to suggest that global power emissions are coming into the peak zone.
The bad news: this leaves the legacy layer of fossil fuel power fully in place. Emissions declines cannot be realized until that underlayer is attacked. If you are thinking well, we got close this year, we’ll surely overtake next year, please remember that total system demand will grow again next year too. Moreover, the threat now is that total demand breaks out into a higher, annual rate as we further electrify the economy. Note the array of potential growth rates, and the historical rate (2010-2022) , in the chart:
You are reading a free post from Cold Eye Earth—a newsletter widely read among academic, financial, and policymaking institutions and which enjoys substantial readership internationally. The regular publication cycle occurs every other Monday, and adheres to a strict deadline: just after midnight Pacific, in time for the morning readership in London. Rates are a very reasonable $80 per year (or $8.00 per month). Please consider subscribing.
Friday’s US jobs report indicated a fair amount of underlying weakness in the labor market. The trading action in US treasury bonds was revealing as rates initially rose on a strong headline number, then clawed back that move, only to rise again into the close. Price gains in US treasury bonds have been strong and swift the past three months, and that advance has clearly come in for some profit-taking. Meanwhile, a majority of participants are still betting on a rate cut from the FOMC at the 20 March 2024 meeting. The FOMC’s 2024 calendar can be found here.
Overall, it’s rather obvious now that interest rates have peaked, and equity markets have put together a strong rally to celebrate that new visibility. The yield on the German 10 Year bond tells the story well, of a market coming to terms with a change in macro outlook. Suffice to say, interest rate sensitive equities in the renewable space, while still beaten down from last year, continue to slowly recover.
Unlike the United States, Europe pairs steady action against fossil fuels with robust deployment of clean energy. The result is that EU emissions, gently falling for decades, have picked up downside speed the past twelve years, declining 19.6% from 3389.3 million tonnes in 2010 to 2725.4 million tonnes in 2022. That is damn impressive, and reflective of broad adoption of high petrol taxes and congestion and road charges for cars in cities. Emissions are expected to have fallen again in 2023.
Oil prices remain weak, reflecting robust supply and the lack of usual demand strength in China. Falling inflation, of which oil is a component, also diminishes the attractiveness of oil as an inflation hedge. And, the slowdown in US jobs growth probably adds a little extra to the mix. As always, the truest indicator of the global oil market supply and demand balance can be found in OPEC spare capacity.
—Gregor Macdonald


