
The Load
Monday 29 April 2024


Cold Eye Earth won’t be joining the latest wave of worry in energy circles: that AI is going to push global power demand to unsustainable levels. The fundamental proposition of energy transition is to bring everything over to the efficient platform of electricity. So, if you’re worrying about AI and crypto demand why aren’t you worrying also about transportation, air-conditioning, and industrial demand because all that too is coming to the grid. The proper stance for transitionists is to simply say, bring it. Indeed, a more productive way to worry is to fret that we won’t build enough wind, solar, storage, and nuclear power to handle all the load growth that’s coming anyway, and as a result, natural gas will continue to exploit the shortfall. Worry about natural gas, not Microsoft’s GPU demand.
The world currently uses over 29,000 terawatt hours (TWh) of electricity each year, and growth is going to take that figure to at least 37,000 TWh by 2030. We already face a challenge covering that growth with wind, solar, and storage so it’s understandable to be concerned. But there’s simply nothing special—or new—about data center demand growth. According to a report this year from the IEA, data center demand may double from 2022 to 2026. Scary? Not really. Demand doubled over the previous four years too.
Chart from the IEA Electricity 2024.

Again, your baseline expectation should be that global electricity growth is going to grow faster than ever before, now that we propose to call upon the grid heavily as the primary platform for economic growth. AI, crypto, and data center growth may add another 400 TWh by 2026. So what? Total global demand is going to grow by by over 25% off a huge base, advancing by at least 8,000 TWh from 2022 to 2030. And the more successful we are at rapidly moving cars and industrial processes to the grid, the faster we will need to deploy new clean power capacity to handle it all. Last year, the world put 14 million new EV on the road, representing new power demand of 42 TWh. (14 million X 3000 kWh average annual consumption per global vehicle / 1,000,000,000 = 42 TWh). But we’re still early in the EV adoption game and the world has over 1.5 billion vehicles, the vast majority which are still running on petrol.
Data center growth simply doesn’t scale as a notable problem compared to the challenge we face at the global level. Instead, this is a story that is a very big deal at the corporate scale, with enormous implications for the economics of providing AI services to the public, and the required capex to be undertaken by Meta, Google, Microsoft and Amazon. When the stock of Meta was rocked this week on the announcement that its AI infrastructure spending was set to soar, you can begin to see how the AI energy-growth story slips out from its appropriate lane in the business world and winds up in the wrong place. Put another way, humans are wired to be sensitive to small scale stories which are often more relatable. Hardly anyone knows the world is on course to add 8,000 new TWh of demand to the year 2030, so going from over 400 to 800 TWh globally to support the cloud sounds like alot, to most people.
When you read breathless stories about US data center demand growth, just remember that this is a 20 year old story, with several big waves already behind us. And finally, it must be remembered that US based technology giants are themselves prime movers in the deployment of wind and solar, with most of these same companies having contracted to build their own utility-scale clean electricity projects already, often far in advance of states and municipalities.
In each of the previous transitions, observers became alarmed at the new dependency being formed on coal, and then on oil. If we want to make sure we compete with fossil fuels effectively, we will need to not only meet all the new demand coming onto the grid, and then some, but we shouldn’t complain about it either. We shouldn’t gate-keep who or what is coming to the grid. We should instead welcome the demand, as demand is required to keep driving the cost curve downward. Build. Build. Build. Deploy. Deploy. Deploy.
US natural gas demand growth has been so strong, for so long, that it’s about to overtake oil as the top energy source used by the United States. Over the past year, Cold Eye Earth has devoted at least a quarter of its content to the natural gas problem. A few points. Natural gas has not only been growing strongly in the US for more than a decade, but it continues to grow at a fast pace. Yes, natural gas along with wind and solar helped kill coal. But at some point in time, that “win” fades, and fades rapidly, and you find yourself with a whole new problem of emissions growth. And apart from natgas growth in industry, we’re still not suppressing natgas growth even in the power sector because the replacement of lost coal capacity is still not entirely met by renewables. Result: natural gas consumption reached 33.6 quadrillion btu last year compared to oil’s 35.4 quadrillion btu (quads). Notice also the big leap that started in 2018, when natural gas began to lift from 28 quads.
The chart is interactive on desktop devices at the Cold Eye Earth website: mouse over it for data.
Global solar capacity soared once again last year, and the world now has over 1.6 TW of installed solar. According to a just released market report from the IEA, capacity grew by an astonishing 446 GW in 2023. This figure is pretty close to estimates from other analytical teams, like BNEF. The IEA notes that one of the helpful drivers in last year’s performance was overcapacity, and the resulting weakness in PV prices. Outlooks across forecasting groups suggest the world will add 500 GW this year, at minimum, with some high side forecasts reaching above 600 GW.
Quick comment: the lift-off you see in the chart below is probably not anomalous. We have very obviously reached the stage where PV production capacity is running well ahead of production, clearing the air up above to reach for the stars. Prices falling, supply chains strengthening. The solar explosion is here!

Sometimes the big picture is not enough, and one really needs the biggest picture of all. This brings us to the Kardashev scale, which conceptualizes how civilizations might harness energy as they move through technological hurdles, transforming their capabilities. I think it’s helpful to remind ourselves that we are still very, very early on the Kardashev scale, as we’re still stuck trying to harness enough energy (without killing ourselves first). What’s also clear is that, along with nuclear power, solar is precisely the kind of technology that will allow human civilization to fully depart the age of energy scarcity and enter energy abundance, achieving the Type I stage.

Load growth is inevitable on the global scale but the extent to which load will grow in the OECD is less certain. To be sure, bringing energy demand from the transportation sector over to the powergrid will unquestionably drive demand growth. But the OECD is also seeing, and will continue to see, the adoption of technologies that harvest inefficiencies. The heat pump revolution in Europe is a great example: what had previously been assumed to be a structural level of heating demand through the use of natural gas was converted, and thus lowered, through the adoption of electricity-powered heatpumps. Yes, that will place upward pressure on power demand but it will lower overall energy demand.
The US has only just begun the process of heat pump adoption, and the creation of high-energy efficiency as a standard. While it’s true that data center growth and industrial growth will place additional upward pressure on the US grid, it’s also the case that massive inefficiencies in how the US uses energy will eventually be expunged, thus placing downward pressure on load, at the same time. We keep being told however that US total electricity demand is nearing a take-off point. Well, sorry, that may be true but we’re still not seeing it.
The chart below contains two insights. One, it shows the market share growth of combined wind and solar in the US electricity system. Two, it shows total load, thus allowing us to assess how rapidly the system overall is growing. Answer: it’s still not growing by much, and has yet to decisively move beyond the 4000 TWh of annual demand that have characterized US power for a long time.
The chart is interactive on desktop devices at the Cold Eye Earth website.
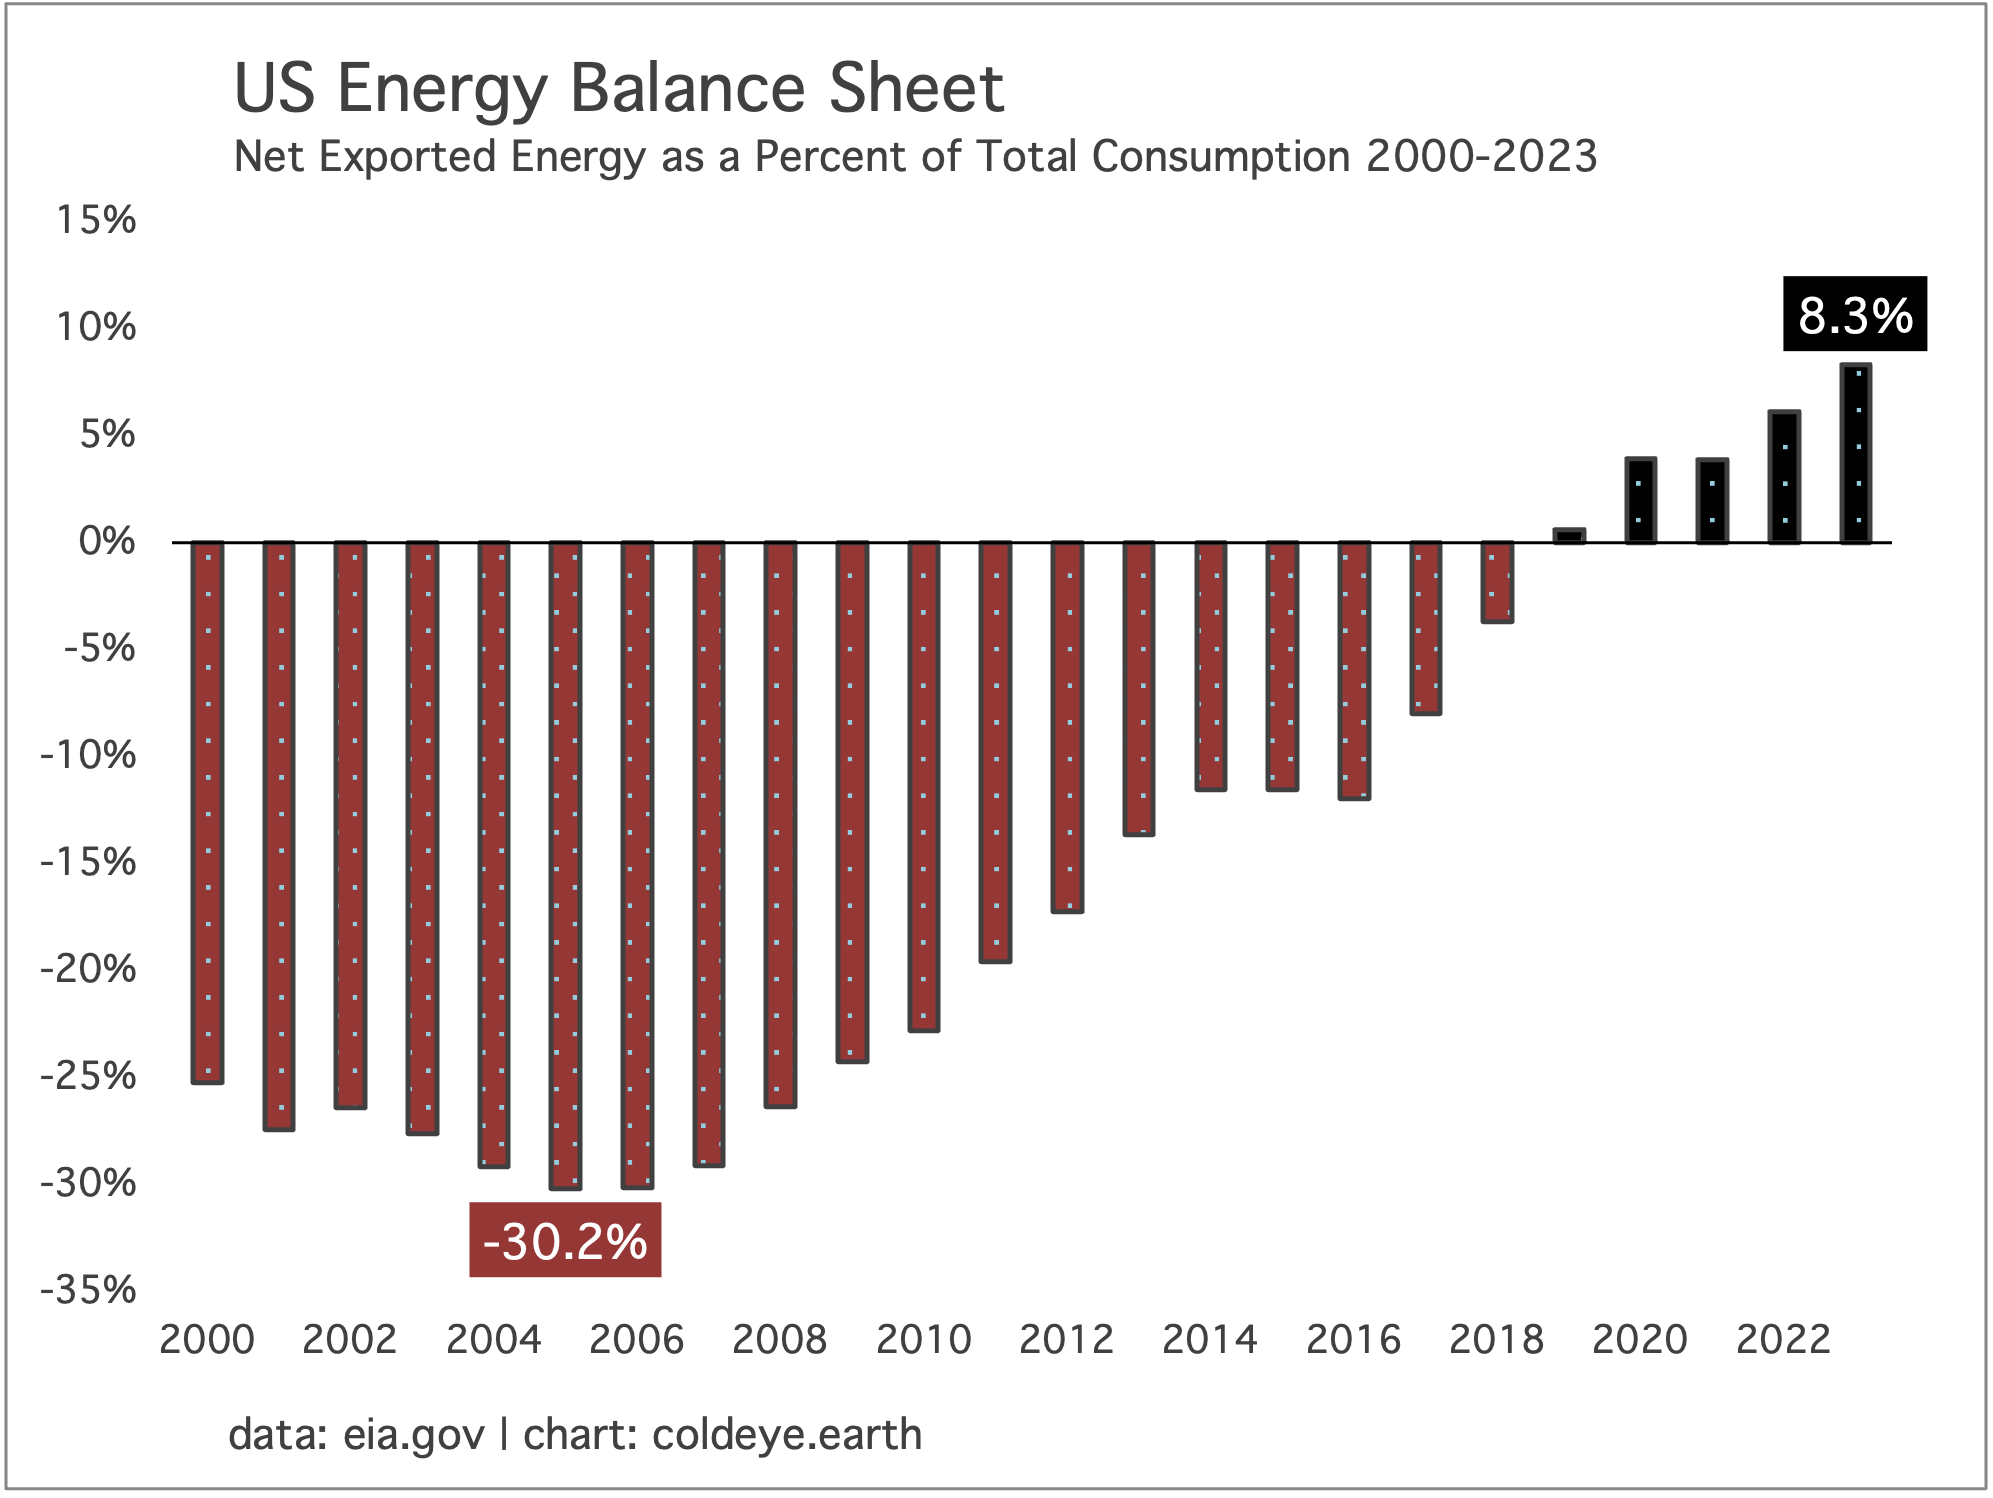
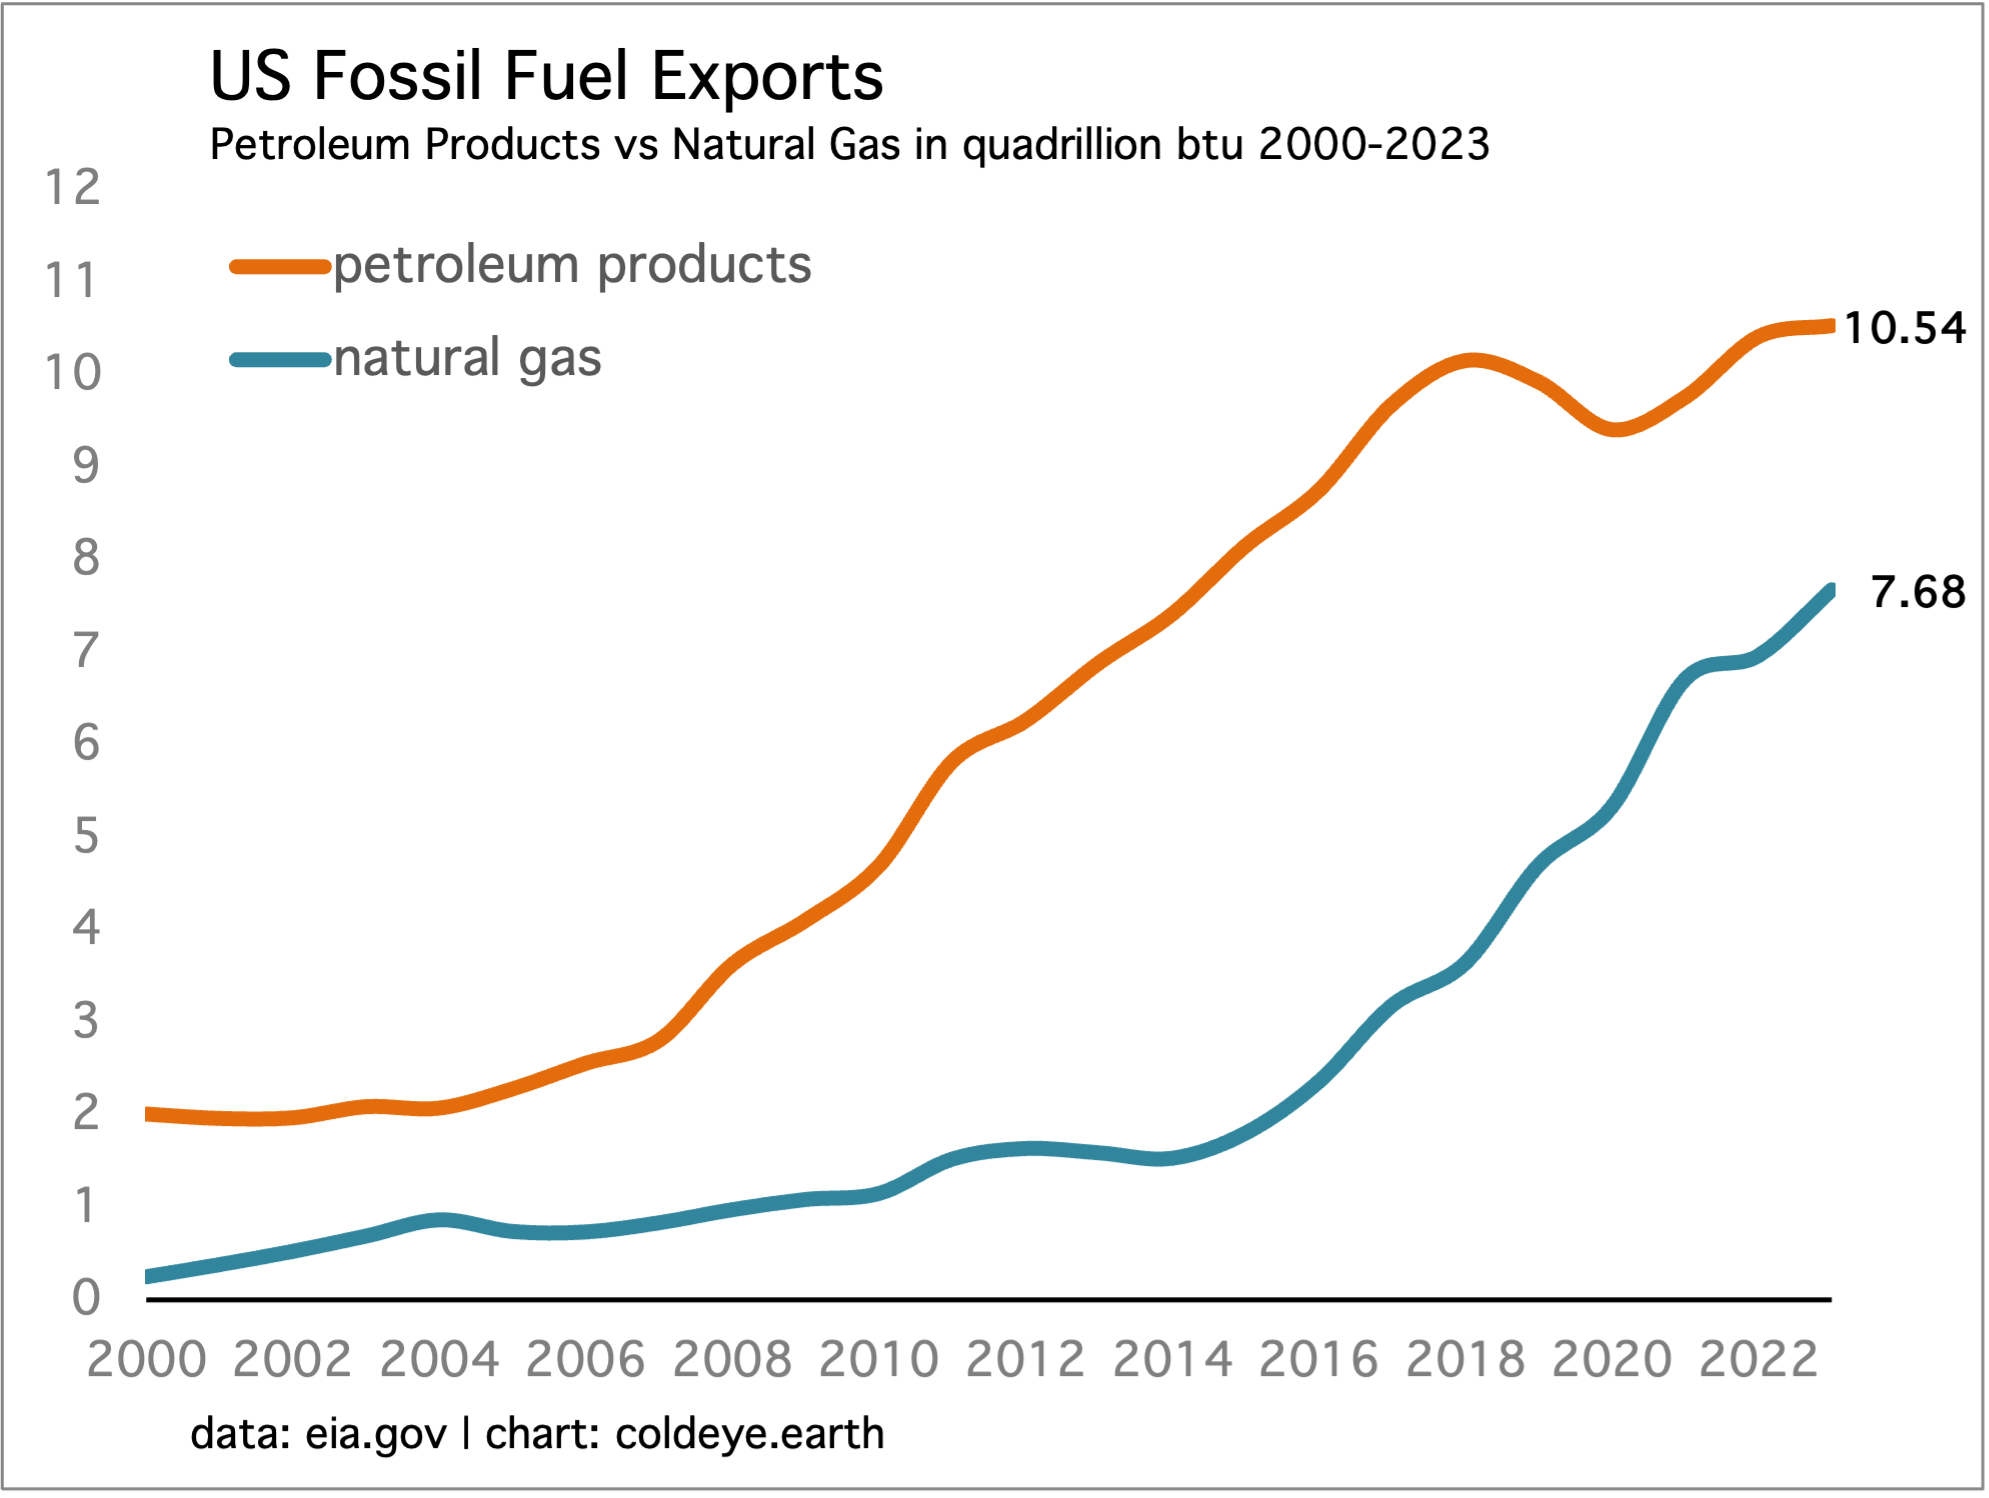
The US continues to emerge as a global energy colossus, overproducing natural gas and petroleum for export, and increasingly integrating wind and solar into its domestic power system. While US exports are far greater in value outside the energy sector, it’s still the case that the structural tipping of the country’s energy balance sheet helps keep a firm leg of support under the US Dollar. Net exports are already above 8.0% of domestic consumption, and there’s clearly no limit on the supply side to create even more natural gas and petroleum products.
US natural gas prices are crazy cheap on a nominal basis, and even cheaper on an inflation adjusted basis. There’s a thesis about US natural gas prices that’s understandably logical, but which has never come true: soaring LNG exports must eventually push up domestic prices. Nope. Didn’t happen. Isn’t happening. Cold Eye Earth has been clear on this question for years. And that view is derived from a different thesis: that the volume of economically recoverable natural gas in North America is vast, gargantuan, almost incomprehensibly large.
Recent US natural gas prices in the futures market have been hovering at around $1.60 for a million btu, so this post from the EIA a couple months back works well to illustrate:
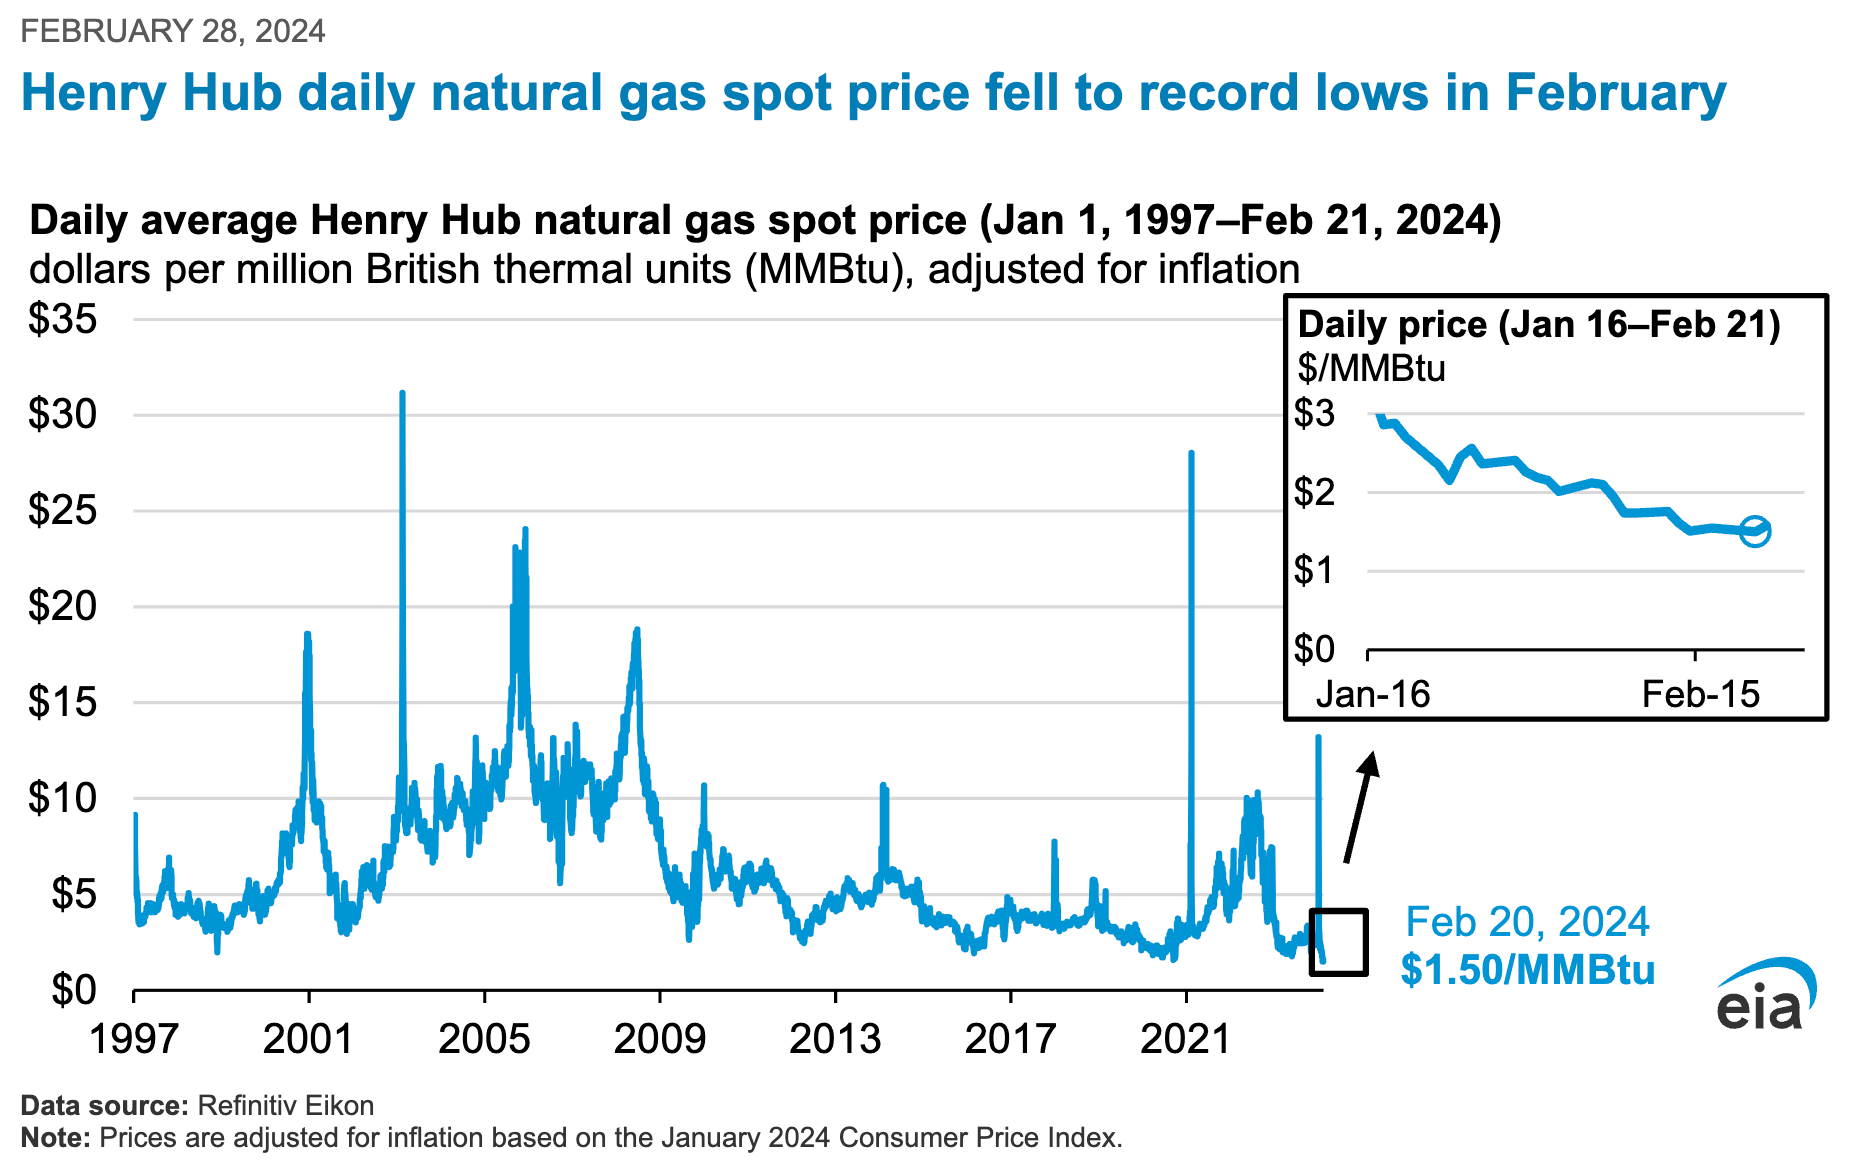
A million btu of natural gas for a buck-fifty, in 2024? On an inflation adjusted basis going back just five years, that’s less than a dollar in 2019 terms, and it gets cheaper from there as you work backwards. (The chart above anchors to 2024 prices, but you get the point). Thus, we add another factor to the natural gas problem: it’s so damn cheap it’s practically free.

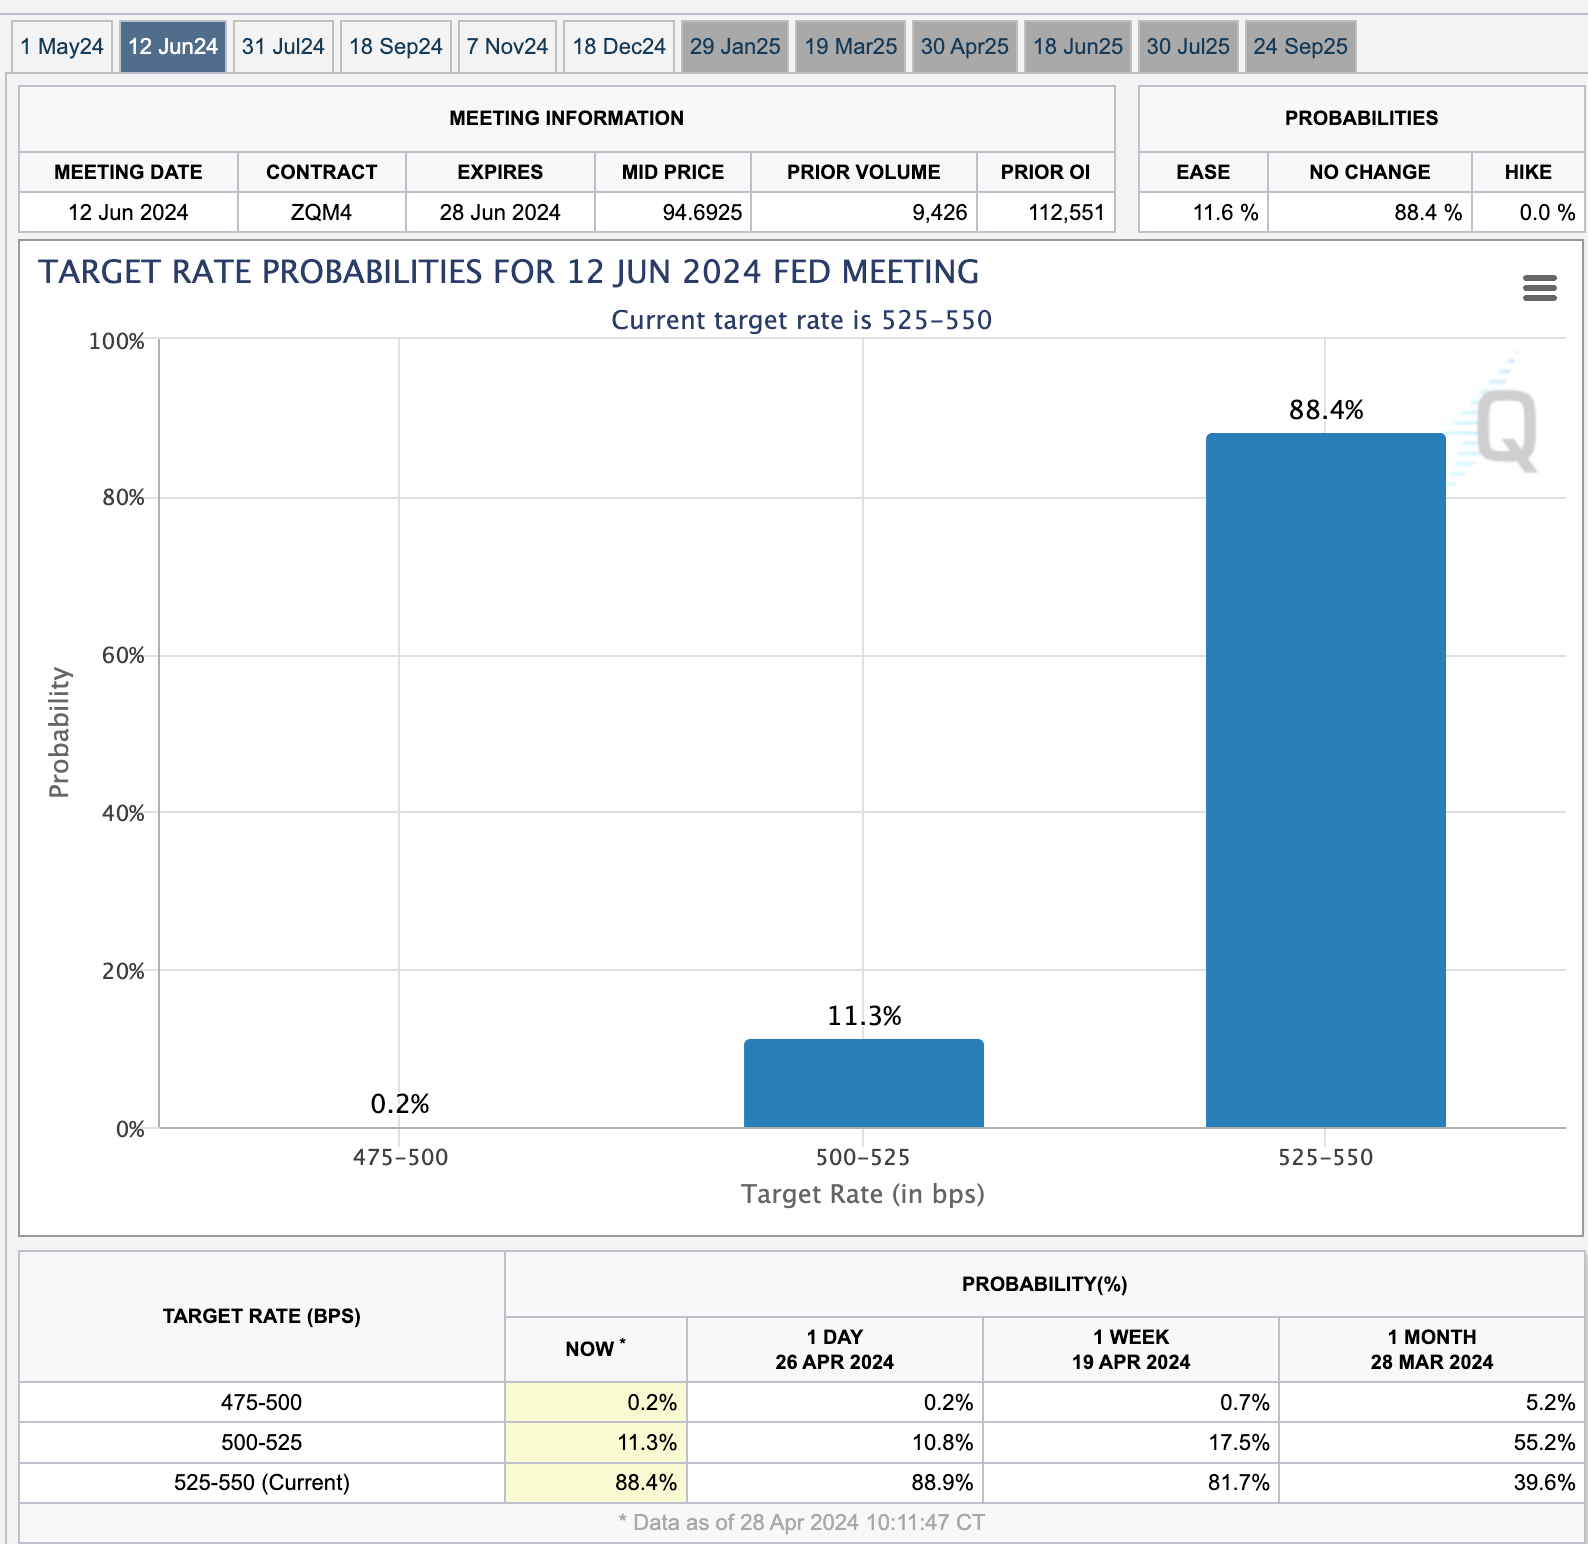
The FOMC meets this week to decide the future course of interest rates, and no one including the market expects them to raise, or to cut. But this meeting, which starts on Tuesday 30 April and concludes on Wednesday 1 May, is not the meeting drawing attention. Rather, it’s the June meeting attracting all the eyeballs. You see, only a few months ago, markets believed the signal coming from Jay Powell and the FOMC was that June might be a good time to at least make a safety cut of .25% as a way of ensuring that the Fed was not engineering the next recession. Markets then placed a strong probability on a cut at the June 11-12 meeting, as reflected in the futures market, which expected the Fed Funds rate to pull back from the floating range 5.25%-5.50% to range just a touch lower, at 5.00%-5.25%. Indeed, as recently as just one month ago, markets were pricing in the chance of a June cut at 55%. Today? Just 11%.
Interestingly, it’s not clear this collapse of cut expectations has affected markets much. Yes, US equities have weakened since the surge in early March. But they are recovering again after a multi-weak pullback. What to conclude? The US economy is simply too strong to send equities lower—but the price for that strength is that market yields are not going lower either. And that’s where we are, right now. Many sectors, like wind and solar, would prefer that rates are lower. But, it appears that to get rates lower we need a weaker economy along with the continued softening of inflation. For now, the strong economy is in control.
—Gregor Macdonald