
Tumult
Monday 5 August 2024


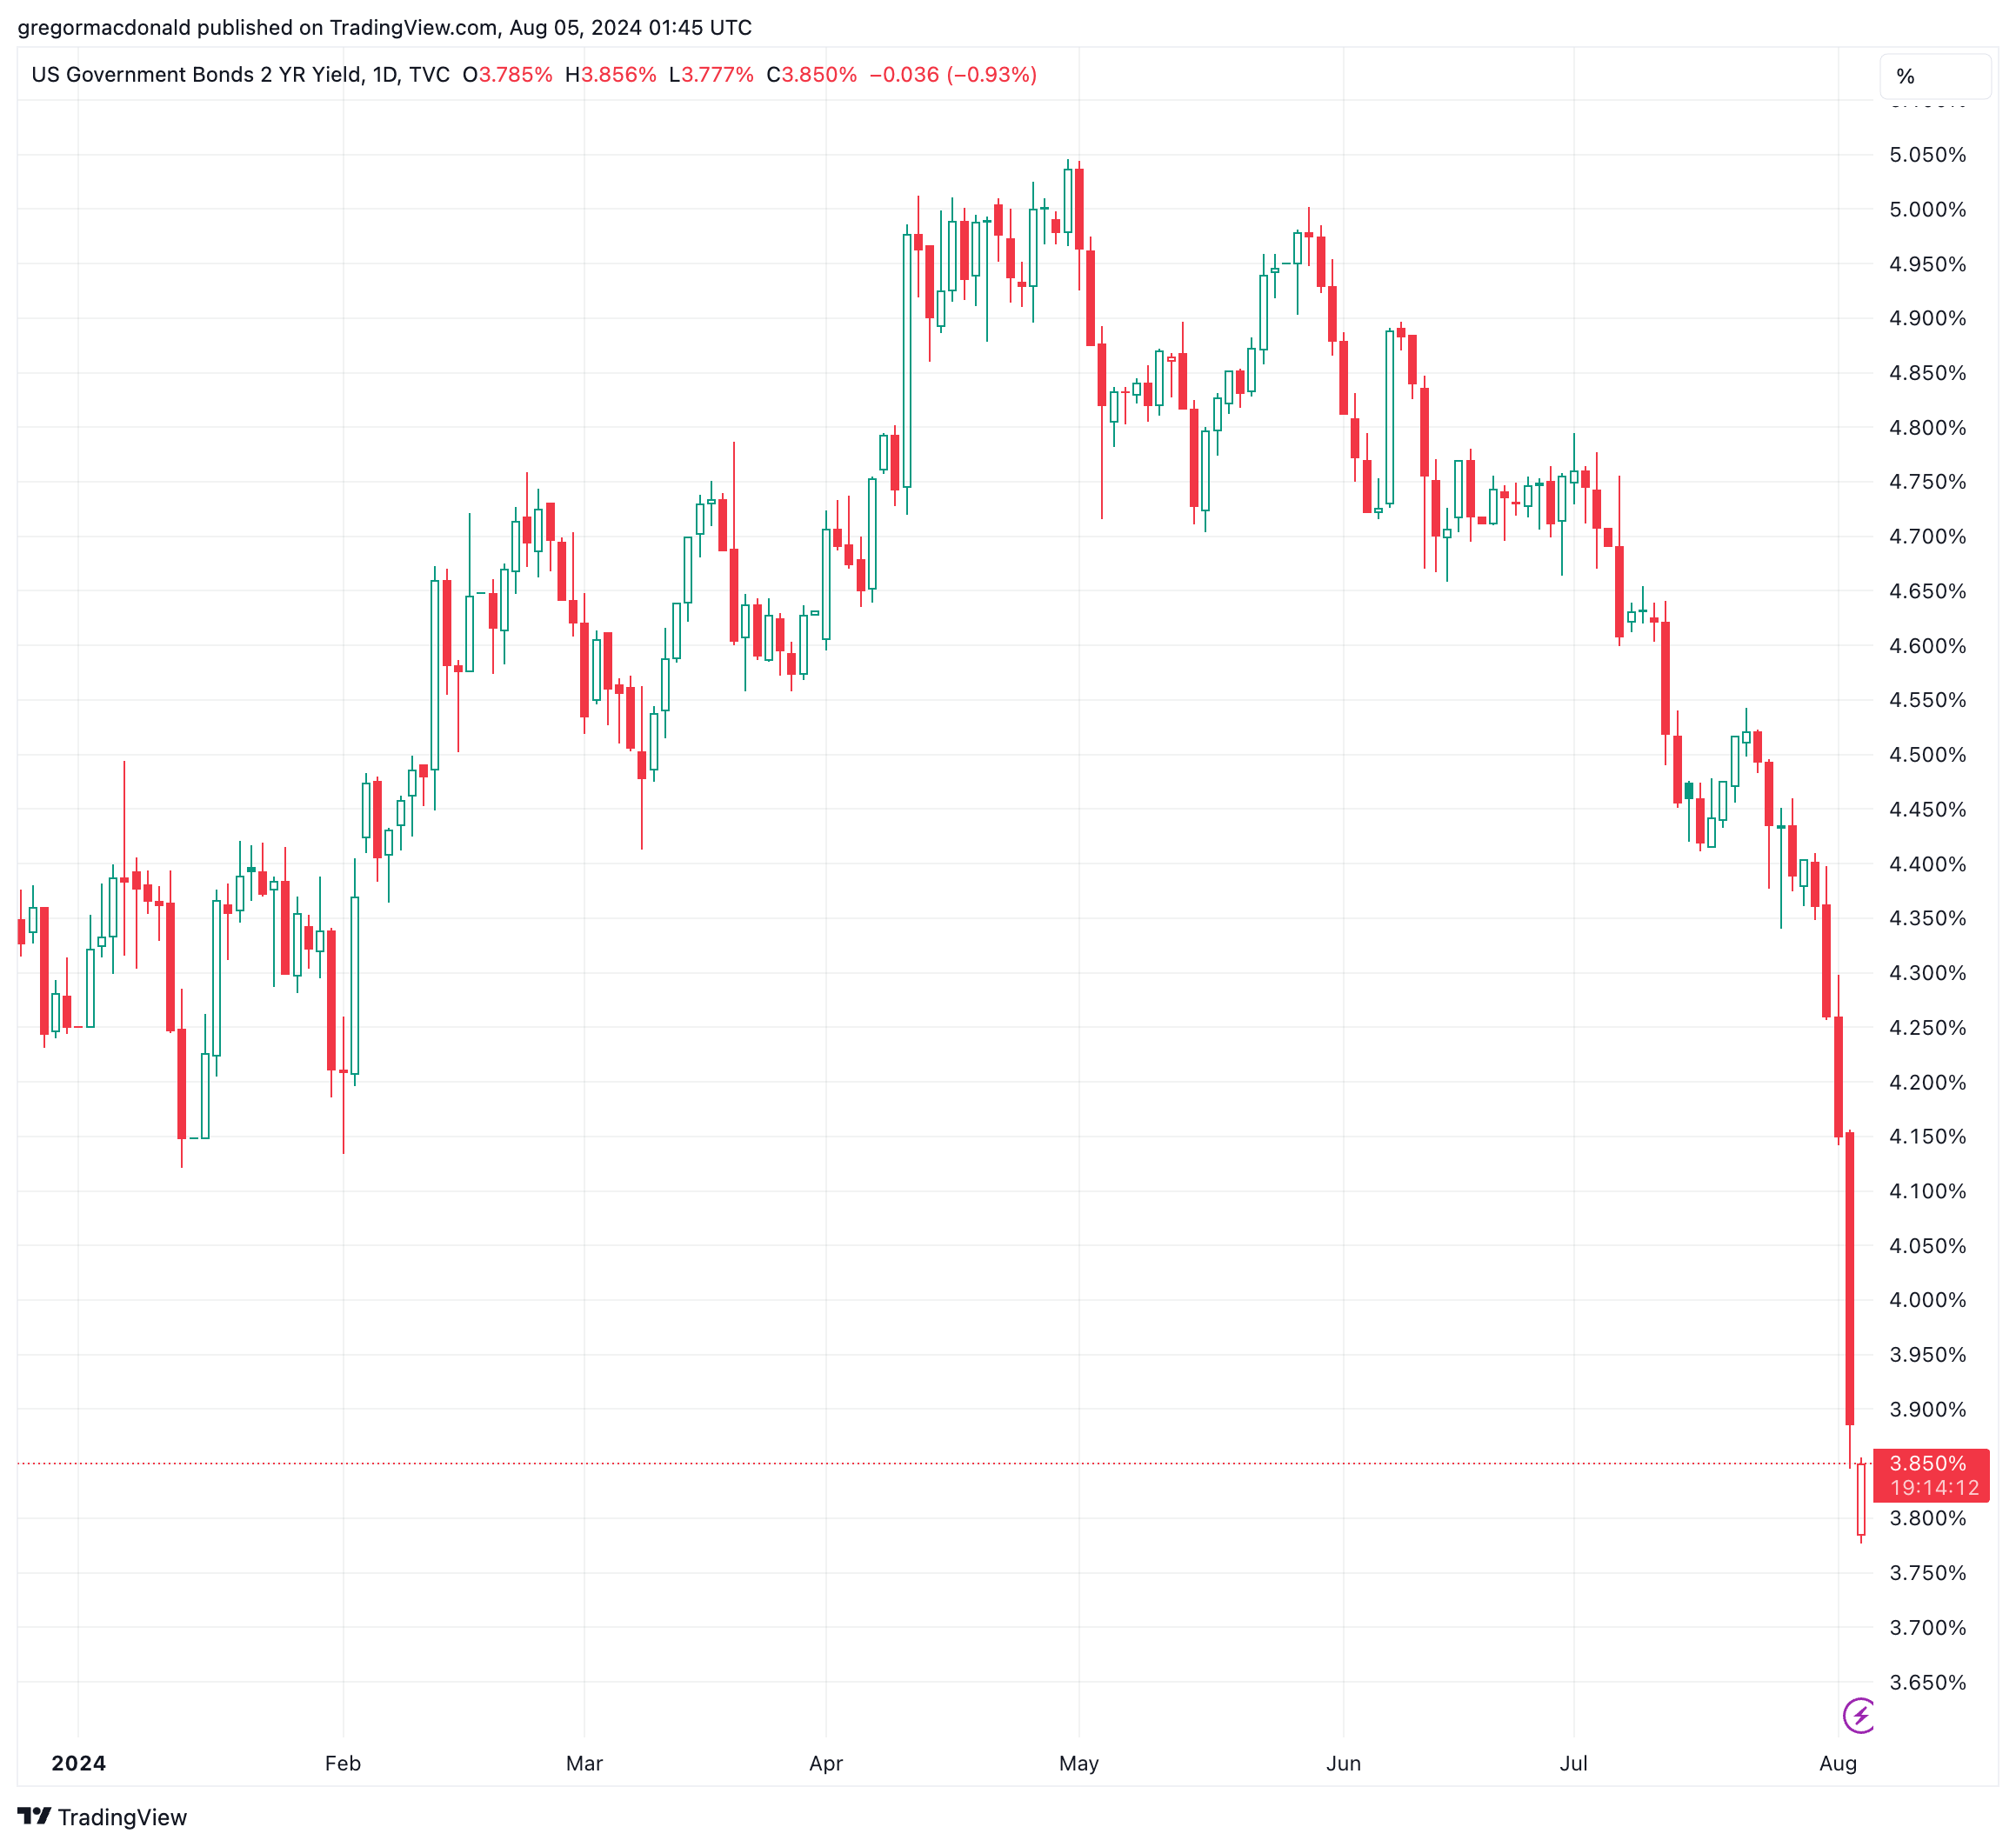
US interest rates cratered last week as the long anticipated slowdown in jobs growth finally arrived. Over a five day period ending Friday, the yield on the 2 Year treasury note fell from a high of 4.40% to a low of 3.89%. At the long end, the yield on the 10 Year fell from 4.20% to 3.80%. The dramatic move in rates was in part a response to Fed foot-dragging on rate cuts—signaled at the FOMC meeting on Wednesday—but Friday’s jobs report put real energy into the downside acceleration. The report, and the prior revisions lower, quickly shifted market sentiment, which gave way to the rising risk of a recession. In the Fed Funds futures market, anticipated rate cuts in the second half of the year have now nearly doubled from a total of 25-50 basis points (beeps) to 75-100 basis points. Was this all just an overreaction?
Probably not. Many observers, even critics who badgered the Fed for waiting too long to raise interest rates back in 2022, have been arguing for months now that Fed Funds currently at 5.25%-5.50% is unnecessarily high, by at least 100 if not 150 beeps. Indeed, by many measures inflation has now fully fallen to the various preferred measures of the Fed’s 2 percent target. So, the growing opinion that the Fed was making yet another mistake was already in the air before Friday’s jobs report. When the headline number arrived, growth of just 114,000 jobs, the data confirmed those suspicions, and worse, suddenly made Jay Powell and the Fed look as though they were, once again, not in touch with reality.
Now, one can argue that this is just one report and that the general valence of strength in the US economy has not been undermined. That’s reasonable. The counter argument however is that the yield on the 2 Year fell to levels last seen during 2023’s regional banking crisis. And at those levels, a yield around 3.9%, the market is not just suggesting but screaming that Fed Funds are way too high, by at least 100 basis points.
With pressure now bearing down on Powell and the Fed, we can anticipate that whatever arguments the hawks were still clinging to within the FOMC have now collapsed. That opens up two possibilities for the next six weeks into the next meeting: one, that Powell and the doves get loud, and start guiding the market to more aggressive cuts, or two, that the Fed actually does an inter-meeting cut. Those are conditions that are likely to keep market rates suppressed. In other words, unlike 2023’s brief banking crisis, this is shaping up to be a more durable and lasting change in the macroeconomic weather.
Chevron’s decision to ditch California for Texas is a logical corporate move, given that oil is now a no-growth market. Managing decline requires a different set of tactics than managing growth, and Chevron will, in the years ahead, likely enjoy supportive policies from the state of Texas. Most of the global oil industry has long had some sort of presence in the state (including the international majors like BP and Shell), and this alone will make for an enduring constituency. The safety in numbers that Chevron seeks is not unlike the kind that the coal industry, amidst its own decline, has enjoyed in states like Wyoming and West Virginia.
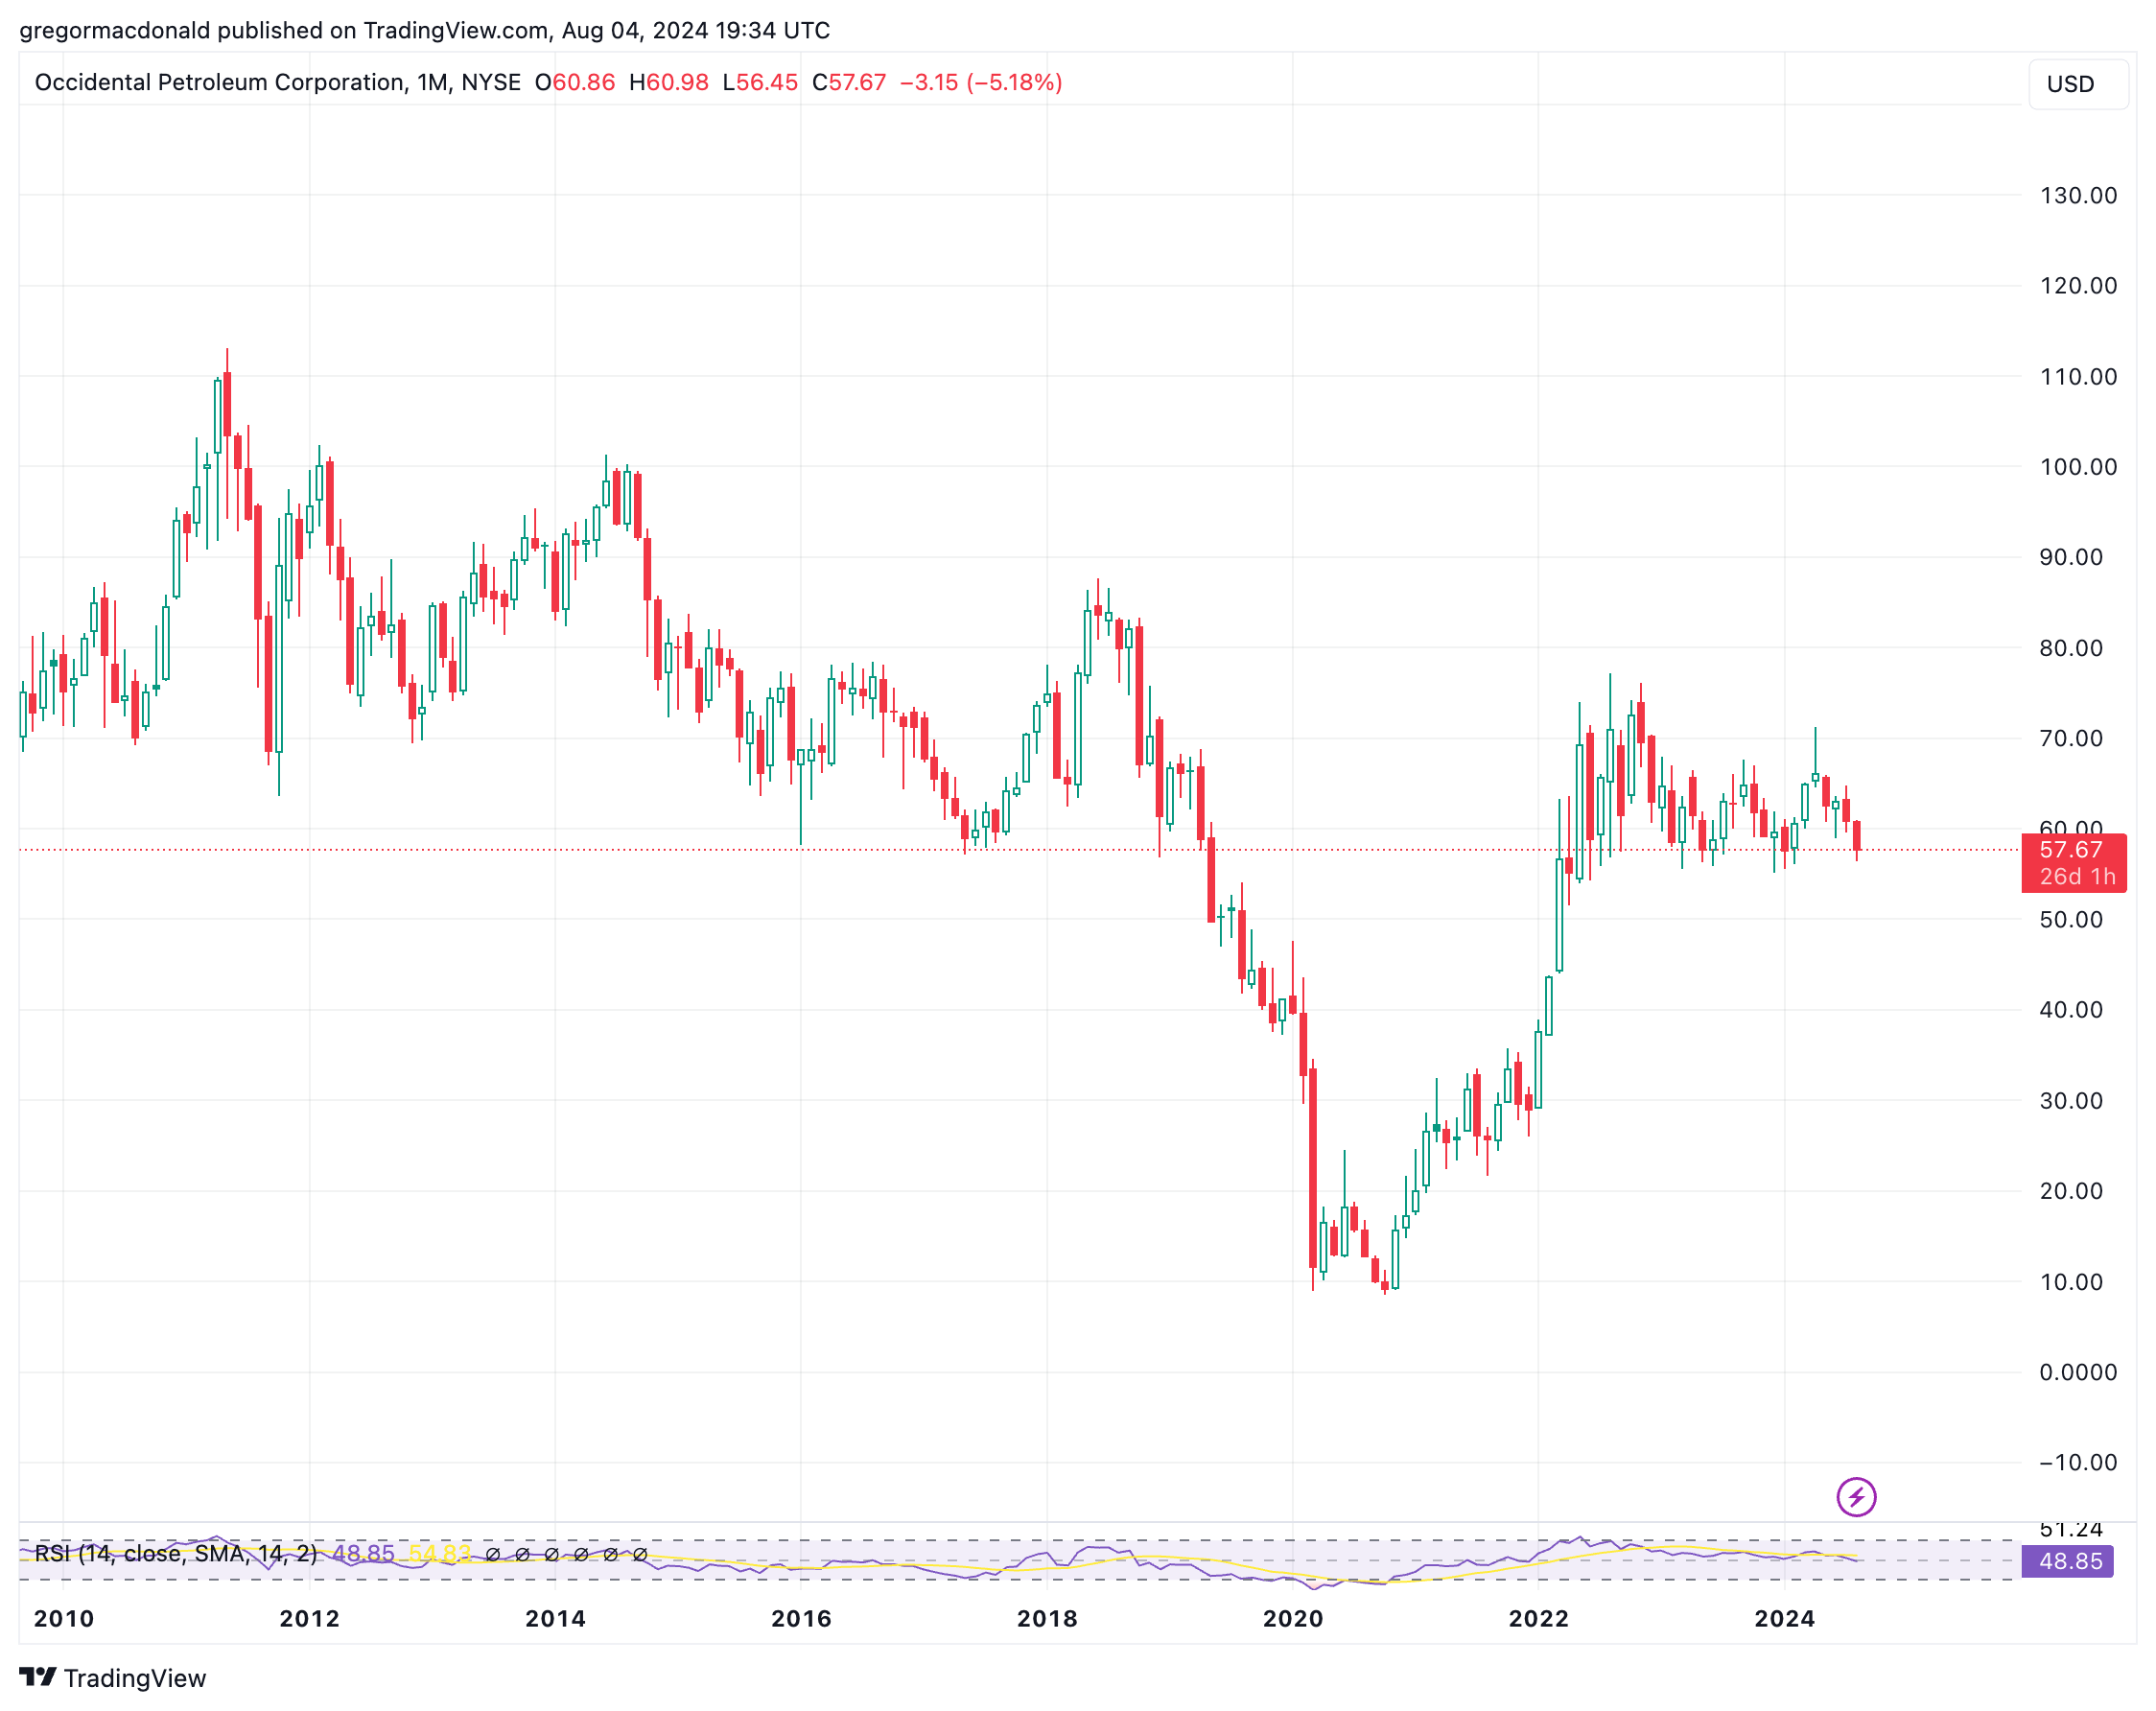
When we speak of the end of growth for the oil market, it’s a concept that begins with actual global demand growth, but also includes the profitability and growth of the corporate oil sector. With the exception of the brief oil price spike during Putin’s initial invasion of Ukraine, most investments in oil have been dead money for years. Take, for example, the extremely well run and pure play Occidental Petroleum (OXY), a favorite of Warren Buffet. Despite Buffet’s ongoing investment and endorsement, OXY has been a non-performing investment for years. Worse, like many other investments in the sector, OXY has barely even kept up with inflation. That fact alone is signaling something additional: the era in which oil and gas investments protected you against inflation is no longer working.
When we zoom out to the big picture, and we take a look at how global oil demand has been evolving over the past five years, we see the post-pandemic period has been marked by a slow crawl back to the 2019 highs, which was finally exceeded last year. However, this recovery period only extended the slow growth problem that developed last decade. That’s the main reason why oil prices have been tame for years. With demand growth plodding along at 1.00% or less each year, the oil industry has no difficulty whatsoever bringing on the marginal barrel in time to meet demand. The out-of-balance oil market that bulls have dreamed of for years is now a thing of the past.

The expectation here at Cold Eye Earth, which has been the case for years, is that global oil demand lost its grip on growth in 2019, and is destined to roll along on a bumpy plateau for years—unable to establish a new growth trend, and importantly, unable to decline. Changes in global transport, electrification, and efficiency dictate this outcome: finding new growth for oil is hard to come by, but expecting global oil demand to fall just yet is an error. Oil demand will eventually enter a sustainable decline, but we are still years away from that outcome. Just for reference, the forecast for oil demand here at Cold Eye Earth has for five years nearly matched the British Petroleum forecast: oscillating plateau post 2019 with flickers of vanishing growth, and then more stasis after 2025. At the moment, 2023 demand is 1.4% above the 2019 level—within the 1-2% expectation voiced here for some years. As always, the vast majority of observers will be trapped between two falsities: further growth, or immediate decline. The plateau is far stronger as a thesis than either of those two routes.
Oil has lost its grip on growth, it must also be said, during a period when oil is actually dirt cheap on an inflation adjusted basis. We’re so very far away from the $100+ level of the 2004-2008 period that today’s $75 oil is more like $50 oil. You can come at this a number of different ways, looking at wages vs oil, or just by reviewing inflation-adjusted oil data. The important takeaway however is that oil is no longer in an adoption phase, as it was throughout the bulk of the 20th century.
The US political landscape has just experienced one of its most tumultuous periods ever, all in a compressed timespan of the past 6 weeks. As we look ahead to the November election, let’s look at some salient facts.
• Joe Biden never had a lead in the presidential polling, and it was therefore correct to deduce that his age was a depressant on Democratic voter enthusiasm. After the debate on 27 June, it then became clear that the risk of staying with Biden was higher than the risk of replacing him. This has all been borne out by the polling on Harris in the past few weeks. In other words, it was Biden and Biden alone who was preventing the Democrats from enjoying the standard advantages of incumbency, and a strong economy.
• For the Democratic nominee, winning all three of WI, MI, PA is non-negotiable. The structural advantage in the electoral college which Republicans enjoy means that the GOP nominee need only pick off one of WI, MI, PA to greatly reduce, if not block, the Democratic nominee’s pathway to 270 electoral votes. Sure, you can make a mathematical case that the Democratic nominee while losing one of the big three could somehow make it up by stringing together GA, AZ, NV and then perhaps NC. But it must be remembered that Biden barely won GA and AZ, and his third narrowest win, WI, was in fact 2020’s tipping point state.
• The Democratic nominee must win the popular vote by at least 2% simply to have a shot at winning the electoral college. To win, however, the nominee must take the popular vote margin to 3% if not 4%. Additionally, expansion or contraction of the third-party vote also has a major effect on this calculation. For example, in 2016, Clinton won the popular vote by 2.08% against Trump. But the third party vote soared to 5.7%, which ultimately hurt Clinton further. In 2020, Biden was able to tame third-party vote share, which fell back to a more typical 1.8%. And Biden’s popular vote victory over Trump in 2020 stood at 4.46%.
• Biden won 306 electoral votes in 2020 but if Harris were to exactly duplicate Biden’s map of wins and losses in 2024, she would garner instead 303 electoral votes. Those 3 electoral votes are all part of the ongoing erosion of the Democrats’ electoral college strength, as apportionment continues to follow population growth in the sunbelt.
• Trump’s popular vote share has never made it to 47%. He was held to 46.09% in 2016, and 46.85% in 2020.
Now let’s take a look at an electoral college map. We begin as always with the 2020 result as duplicated on the 2024 map. This time however, let’s identify the six crucial swing states which we’ll call the Midwest Three (WI, MI, PA) and the Sunbelt Three (GA, AZ, NV). Biden won all six in 2020 but again, his margins in two of the Sunbelt Three, GA and AZ, were so paper thin that these must be regarded as lucky cards, bonus wins that are nice to have but in no way compare in importance to the Midwest Three.

If Harris gave back the Sunbelt Three but managed to hold on to the Midwest Three, she would wind up with exactly 270 electoral votes—the absolute minimum needed to win. The map also serves to indicate where the Dem nominee begins their journey: at 226 electoral votes compared to 235 for the GOP nominee—yet another lens through which to see GOP structural strength in the electoral college. All the red you see and all the blue you see on the map is quite sturdy, and hard to dislodge. The GOP is never going to win CA, and the Dems are never going to win SC. Maybe the Dems could play for NC this year, which was Trump’s tightest margin win in 2020 at 1.35%. We shall see. Overall, however, the margins of state victory skews heavily towards the GOP nominee.
Consider this: Biden won three states by margins of less than 1.00%—GA, AZ, and WI. But Trump’s narrowest win begins above 1.00%—in the just mentioned NC. From there, his next two narrowest margins were in Florida at 3.36% and Texas at 5.58%. Here’s another comparison: Trump handily won his three narrowest margin states which total to 86 electoral votes (NC, FL, TX). But Biden barely won WI with a 0.63% margin, though he did do better in PA with a 1.16% margin and Michigan with a 2.78% margin. And yet, Trump’s Red Wall, if you can call it that, totals 86 electoral votes to the Blue Wall at just 44 electoral votes.
Although it’s quite true that the Harris campaign has burst onto the scene with powerful momentum, and it’s equally true that the Trump campaign has started to flail quite badly, the past 6 weeks should serve as a reminder that dramatic changes in the political weather can occur literally overnight. All this said, any harm that may arrive in the next 100 days for either campaign is more likely to be self-inflicted, than the result of opponent craftiness. We’ve seen several examples of such self-harm on the GOP side of late, but at the moment the Democrats are surprisingly not making mistakes nor are they shrinking, as they often do, from the task. If those patterns continue, it would be reasonable to think that the Harris campaign can regain the minimum, required 2 point lead and then start working on getting to a 3 to 4 point lead.
Needless to say, developments in interest rates and the US political landscape bode extremely well for new energy technology growth and the energy transition overall. While markets are currently overreacting, the trend towards slower growth and lower interest rates is now firmly in place, and as readers know, those are fine conditions under which to cultivate the deployment of new energy infrastructure. Some loosening of the labor market is also likely on the way, as are lower prices for industrial inputs like copper and steel. (Related: the IEA in its latest Oil Market Report dialed back oil demand growth again, noting that oil demand in China actually contracted some.)
In the political realm, most of the legislation America needs to pursue energy transition is already in place, with the exception of permitting reform—something which enjoys bipartisan support. So, apart from the intractable problem of ICE cars, the election of the Democratic nominee simply means that all current trajectories will carry onward, uninterrupted.

Of all the plateau problems, coal remains the most tenacious. For those observers who still incorrectly assume that fossil fuel declines arrive after peak demand, the story of global coal is the cure to disabuse everyone of that notion. Improbably, global coal demand peaked in 2014, then plateaued for seven years, before hitting a new all time high. Worse, the global energy crunch of 2022 was supposed to be coal’s last hurrah (all over again) and then global coal demand reached another new all time high last year. And now for the chef’s kiss: the IEA just reported that contrary to their own previous forecasts, coal in global electricity will not decline either this year or next, but will hang steady as robust growth of global electricity demand will overwhelm efforts to decarbonize.
Gosh, where have we heard before that total system growth is just as much, if not a more important driver, of decarbonization? From the IEA’s July Coal Report:
“Our analysis shows that global coal demand is likely to remain broadly flat through 2025, based on today’s policy settings and market trends,” said Keisuke Sadamori, IEA Director of Energy Markets and Security. “The continued rapid deployment of solar and wind, combined with the recovery of hydropower in China, is putting significant pressure on coal use. But the electricity sector is the main driver of global coal demand, and electricity consumption is growing very strongly in several major economies. Without such rapid growth in electricity demand, we would be seeing a decline in global coal use this year.”
The arrival of the IEA’s Coal Report comes shortly after the IEA’s Electricity Report. Do you remember the IEA forecasting, just last year, that nearly all the growth in global electricity would be covered by clean sources, over the three year period of 2024-2027? Yes, well, that forecast is now wrecked. The IEA is now forecasting that global growth of electricity demand will post an astonishing 4.0% advance this year, and will do so again next year. Wow. From the July Electricity Report:
Over the 2024-2025 forecast period of this report, global electricity consumption is expected to increase at the fastest pace in years, fuelled by robust economic growth, intense heatwaves and continued electrification worldwide. The 4% growth expected for 2024 is the highest since 2007, with the exceptions of the sharp rebounds in 2010 after the global financial crisis and in 2021 following the Covid-induced demand collapse. The growth is driven by strong electricity demand in multiple regions and countries, especially in the People’s Republic of China (hereafter, “China”), India and the United States. We expect this demand trend to continue in 2025, with growth also at 4%. In both 2024 and 2025, the rise in the world’s electricity use is projected to be significantly higher than global GDP growth of 3.2%. In 2022 and 2023, electricity demand grew more slowly than GDP.
Needless to say, there is no way collective growth of clean sources can keep up with this rate of demand growth—which is higher than the high case of 3.25% used in modeling here at Cold Eye Earth. Before conducting those calculations, however, it is not hard to know which two fossil fuels will fill the gap as hydro, nuclear, and wind+solar are unable to keep up: coal, and natural gas.
Advice to think-tanks and other analytical groups: as you sit down to pen yet another forecast for peak emissions in the power sector—for the second or third or fourth year in a row—take a break, and spend some time reflecting.
—Gregor Macdonald