Western Lands
Monday 17 May 2021
Politicians in western resources states like Wyoming and Montana are resorting to desperate if not comical measures in their unwinnable fight to save coal. The latest comes from the Wyoming legislature which has just created a fund to sue other US states that either refuse to buy its coal, or block its coal fired generation. Yes, this is real. But it’s also a tragedy, because even the casual observer can see the downward spiral now in play. By devoting time and resources to deny the reality of coal’s demise, many US resource states are failing to address the inevitability of energy transition.
And it’s ironic too. Many western US states have already seen inflows of tech and other remote workers flocking to the beauty to be found in places like Idaho and Montana. In the past ten years, this has resulted in Washington and Nevada both adding an extra congressional seat. And now, by the 2024 presidential election, both Oregon and Montana will each add a new congressional seat. Montana is notable in several ways. The Big Sky Country state held on to 4 congressional seats from 1912 to 1988, then got knocked down to 3 starting in the 1992 election. But population gains are taking its vote count in the electoral college back to 4. The Montana draw: beautiful landscapes, college towns, mountains, fishing, and of course that big ole sky.
Wyoming, whose population is oscillating between decline and slow growth, and which is currently building one of the largest windfarms in the world, will not resurrect itself on the back of coal. If recent population inflows to the West have largely been motivated by natural beauty, well, other US states and countries around the world have shown you can create a recreation-led economy that thrives. So let’s make an easy prediction. Western resource states will eventually capitulate, become hosts to large scale renewable generation (Wyoming wind, Idaho solar) and towns from Jackson to Boise to Whitefish will see inward flows of new economy professionals. Run this experiment long enough, and the politics of these states will likely change also. Given the present trend towards congressional seat expansion, and the discovery of these western lands by the highly educated, that change is already underway.
A current exhibit of the work of Ansel Adams is both an extraordinary survey of western landscape photography, and a meditation on climate change. Originally curated by the Museum of Fine Arts in Boston, the Adams show tracks the photographer’s work from well before WW2 when California’s population was still relatively small, to the post-war period of housing developments and freeway construction.
But more broadly, by adding in the work of other landscape photographers, the show ultimately resolves into the West’s contemporary challenges, with an emphasis on pollution, drought, run-amok construction, and fire. In just 100 years, therefore, the body of photography covering the West has gone from iconic shots of Half Dome by Adams (1927) to the record of fire, through Laura McPhee’s massively scaled prints taken with a large format camera.
Now through 1 August, Portland Art Museum, Portland, Oregon.

The wealthy tend to live on the west side of cities, with the poor in the east. The findings, from a study of Victorian era England, are not too surprising. Air pollution tends to flow from west to east, and you can see this pattern also in many US cities. Los Angeles in particular comes to mind as smog habitually presses against the San Gabriels in the east, leaving Santa Monica in the clear. A famous West LA place name: Bel Air.
But The Gregor Letter has a pet thesis about this pattern, and how it might change in the future—maybe by a lot. As transport accelerates through electrification, the east side of cities will see their longstanding undervaluation cured. More generally, any urban district that has long been plagued by air pollution will likely enjoy new interest. The San Fernando Valley, north and west of downtown Los Angeles, is probably one of the best candidates to test out this thesis. In a fully electrified Los Angeles (say, 90%), air quality in “the valley” will tip back to its pre-war state when its land was mostly covered by orange groves. Surprising yes, but inevitable.
The electrification of two-wheeled transport represents another large barrier to further oil demand growth. During oil’s bull market, in the 2002-2008 period, a number of analysts noted the expansion in oil demand just from two-wheeled transport. And in particular, through price insensitivity. During that bull market in oil, incomes in the developing world were also rising. So, small engine vehicles drove collective demand through billions of micro-scale users who, using only a litre or two of petrol, were far more impervious to higher prices than an American high-mileage driver.
We are now likely to see the same phenomenon again, but this time in oil’s disfavor. Two wheeled electric transport is super-efficient, and charging up these devices will be incredibly cheap. That makes device ownership the only real demand hurdle, but users will sequentially discover the equation for themselves: buy the device, then save on the operational expenses. In this way, all electrictrification shares a common economic proposition: a larger upfront investment that forms the gateway to lower lifetime ownership costs.
The good folks over at Bloomberg New Energy Finance, for example, have reported that despite the pandemic, sales of two wheelers forged ahead strongly last year with over 25 million units sold. Ahem, that’s alot! But the data point gets more persuasive. Those 25 million electric units composed more than 33% of the overall global market of 74 million two-wheelers. The takeaway is obvious: this market segment is already on its way to full electrification. And that’s amazing. Follow up item: Harley-Davidson this month is spinning out a fully electrified division, Livewire, to handle all future e-bike and e-motorcycle sales.
The IEA has now capitulated to the enduring growth prospects of wind and solar. The Paris based agency has come in for criticism in the past five years for continually underestimating wind and solar growth. Now, it says that high growth is “the new normal” in a fresh report, Renewable Energy Market Update 2021, delivered last week. More astonishing: IEA now says the bulk of new power capacity globally will be renewable. 90% of new generation capacity was renewable last year, and 90% will be renewable this year and next year too, according to their data and outlook. While we cannot know the future with certainty, back-to-back-to-back 90% market share levels in 2020, 2021, and 2022 is not noise, and very much supports the idea of a supertrend.
Two countries are leading the charge: China and the US. China built an astonishing amount of new wind and solar last year, a story already covered in The Gregor Letter. And the US is set to deploy very large volumes of wind and solar this year. Understandably, after 20 years of growth, wind and solar have slowed down alot in Europe. Perhaps that continues, perhaps not. What’s meaningful however is that the IEA is becoming more outcome dependent, pivoting more quickly based on incoming data.
The juiciest aspect of its market update, therefore, is that it has turned its back quickly on its own forecast, made just 6 months ago. In the chart below, you can see the outsized growth from China and the US, and a revision series on the right hand scale (RHS, or, right axis). For example, the November 2020 forecast had the US adding over 50 GW of capacity in 2021 and 2022. But the May 2021 forecast raises that to well over 60 GW, thus raising the forecast over 20% higher. The use of the RHS here seems a tad distracting, but at least they made the effort! In case you find the chart too busy or confusing, all revisions were higher, and the tiny black diamonds are in their own series, on the right-hand-scale. Just eyeballing: China, 45% higher, Europe less than 10% higher, India over 15% higher, and so on. Region to watch: Latin America, clearly. Growth can be fearsome when it comes up from a low base and the higher revision by 40% is extremely promising.
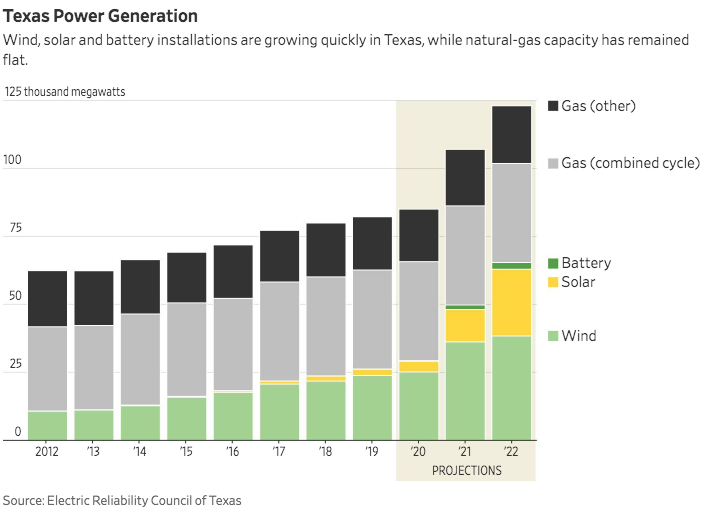
Wind and solar were fated to come for natural gas, just as natural gas once came for coal. And here we are. The WSJ in a comprehensive report has just tipped the end of growth for natural gas in the US market, as plans to build more NG-fired power generation come to a halt. Everyone should have known this moment would come, and it combines two trends now intersecting: a trailing decade of very high growth in new NG power capacity now crashing into the better economics of wind+solar+storage. The latter offers far more flexibility, better arbitrage opportunities in power markets, lower operational costs, and far better return on investment over time.
Correctly, the WSJ report flags the shift in Texas, long a supermercado for power growth in natural gas even during wind power’s strong advance in the state. Eventually, however, the scales were going to tip away from NG to wind and solar. In fact, they may be tipping rather hard:
Solid-state battery research has seen a flowering of human effort, but manufacturing actual units remains the key hurdle. Every week brings fresh news of research and science teams making progress—nay, breakthroughs—on solid state technology. But as battery experts will tell you, the sector is historically beset by high expectations and low follow-through because batteries are just plain hard. The challenge is finding the balance between competing constraints, because the nature of batteries is that solving one aspect of their development can actually make solving other key aspects more difficult. We might analogize battery breakthroughs to pushing on a squishy object: great, you got your finger in one side! Oh no, look what’s just happened to the other!
When Quantumscape went public the company did a very good job assembling battery tech engineers and professors for a presentation (opens to YouTube) that quite nicely elucidates these problems. And that’s why just about every breaking story about solid-state development, like this one from Harvard, requires careful reading. Hey, it’s fantastic that a team at Harvard is working on the problem. But a paper published in Nature is just a very early beginning, and the phrase proof-of-concept can be slippery.
What’s more useful to say is that with so much development activity around solid-state, we are probably zooming quickly towards a solution. But critically, the word solution is also slippery, and must be tied to manufacturing. Right now, the biggest commercial bet on solid-state is very likely the Volkswagen investment in Quantumscape. And it’s also worth following, because VW deals from the platform of Germany’s industrial manufacturing base and expertise—which itself is an edge when we think about solid-state entering actual production. But there’s still no guarantee that particular partnership will monopolize the technology. Rather, based on current activity, The Gregor Letter lightly forecasts that solid-state technology development will experience a kind of convergence. We are likely therefore to see solid-state get close to scalable manufacturing—from disparate teams all currently working on the problem— around the same time.
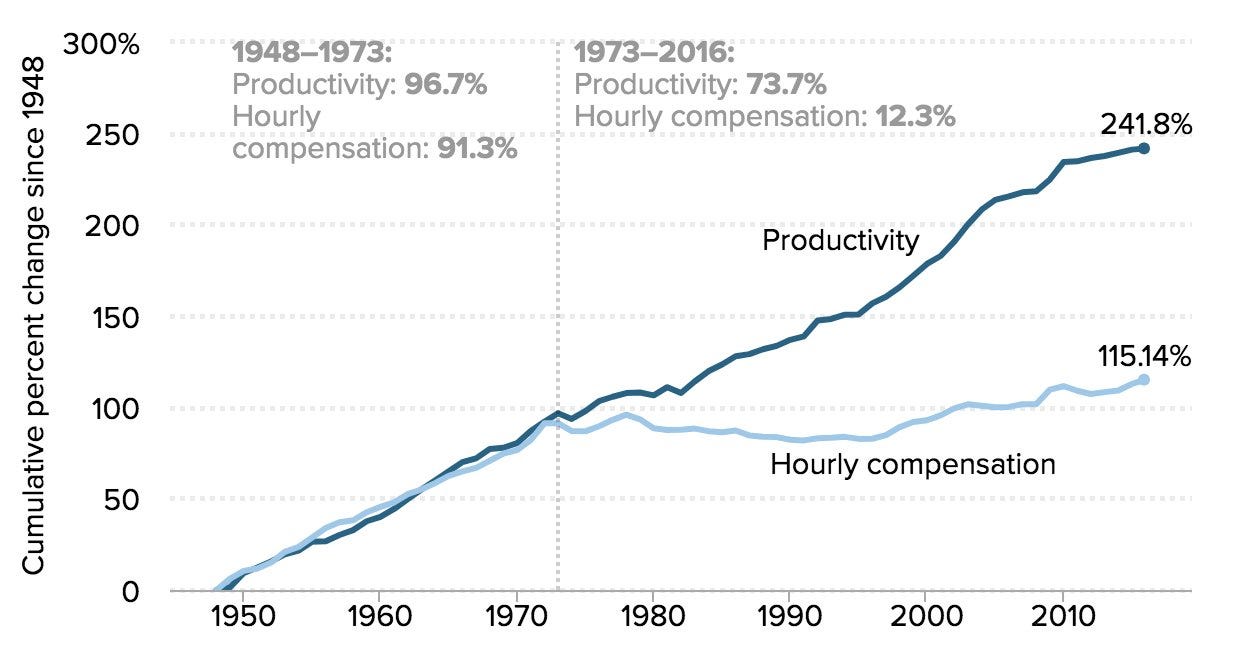
The historic divergence between productivity growth and wage growth is a central concern of the Biden Administration. Jeff Stein of the Washington Post reported on Twitter that the chart below has been identified by the President as “what I want to work on.” While this is not news, it is clarifying. And market participants and other observers should accept that not only is the problem of wage growth a theme that’s drawn more attention in recent years, but an emerging consensus believes the time has come to confront it. And the current President is saying so, very directly.
The chart comes from the Economic Policy Institute, with the title The Productivity-Pay Gap. As you examine it, consider the following: imagine how many different explanations arise for people, when they see it too. There’s the guttural response: well that’s terrible, and it’s entirely because of corporations and their power. But there are far more challenging explanations, baskets filled with multiple causations. Let’s recall, for example, that the late 1990’s tech bubble was also very much a deflationary boom, in which communications pricing fell steadily with myriad knock-on effects. The recession that ensued was a warning that deflation, not inflation, would be the challenge going forward. But what’s crucial to point out is that the 1994-2000 period was likely the culmination of several decade’s progress in computational power, and also offshoring of US manufacturing. By the time of the tech bubble, and then the housing bubble, it almost seemed as if the US economy essentially ran not on output but consumption. And the US Dollar helped drive this trend also, as the world was delighted to ship its products to the US in exchange for dollars.
Thus began a twenty year period, roughly 2000 to the present, in which monetary policy was called upon to fix, nay replace, the fiscal authority which in the 20th century would have been building infrastructure and conducting normal course, ongoing investment domestically. Accordingly, the businesses of America somewhat retreated to a new core, which was more about designing products to be manufactured elsewhere, and which steadily used the tools of the internet to conduct typical 20th century businesses like mortgage lending, investing, and other financial services. As a result, if you did not have either a technical degree, or a humanities degree from a prestigious university, you increasingly found during the entire 40 year period—but especially after 1995—that your job prospects dimmed. And if you were unlucky enough to have both a rough start in life, with no higher education at all—well, America was not investing in rail, cities, schools, water, or its environment—initiatives that would have provided you a job.
Solving the problem in the chart will not be easy. Technology is now driving both the productivity gains, and the wage losses. But you may have a different interpretation. And that’s the fascinating aspect of the chart: there will be—for now and years to come— very different explanations for how the chart came to be, and how it could plausibly be resolved.
The parting shot: Summer is a good time to think about air conditioning, and the way in which a warming world could create air-con demand spikes in the years ahead. That was certainly the case in 2018, when global demand for cooling totally overwhelmed marginal growth of wind and solar. Analysts are increasingly alert to the threat —but it remains a blind spot. The wry take here from Russell Gold, senior energy reporter at the WSJ, is very much on point.
—Gregor Macdonald, editor of The Gregor Letter, and Gregor.us
The Gregor Letter is a companion to TerraJoule Publishing, whose current release is Oil Fall. If you've not had a chance to read the Oil Fall series, the single title just published in December and you are strongly encouraged to read it. Just hit the picture below.


