
Wire Cutters
Monday 21 July 2025


The irrational and destructive power sector policies of the Trump administration have put the U.S. on course to higher prices and lower supply. There are a number of ways to arrive at this conclusion, so let’s go through them.
• Wind and solar are well established now as the marginal suppliers of new electricity generation in the U.S. power market. Wind, solar, and batteries are deployed far more quickly—and far more cheaply— than new fossil generation. Constraining and kneecapping your marginal supplier in power therefore is no different than when a marginal supplier of oil runs into output problems: prices are certain to go higher. While it’s true that natural gas capacity continues to expand, and that combined wind and solar output don’t always cover 100% of growth, they have consistently come pretty close to doing so for the past five to six years. As you can see in the chart below, wind and solar (orange bars) make for a beautiful portrait of how marginal supply functions, as they effectively suppress growth of fossil-fueled power (gray bars). This is the same trend underway, at differing stages of development, around the world.
• Using command economy tactics that are truly Sino-Soviet, the administration is literally going to bully states into keeping old coal and natural gas plants open that otherwise would be slated for retirement. Why are they slated for retirement? Because at some point in the lifespan of these plants, no matter how cheap coal or natural gas inputs become, they are uneconomic to run. Accordingly, ratepayers will be forced to pay the higher costs to keep these open through higher fees in their utility bills. Yes, it really is that crazy. To accomplish this authoritarian move, the administration is relying on one of its new, favorite tactics: declaring a (fake) emergency.
• The current secretary of energy, Chris Wright, is either clueless or a dutiful sycophant willing to undertake every mission he’s assigned, whether he believes in the administration’s plans or not. It doesn’t really matter. In a recent op-ed in The Economist, Wright flogged some deep untruths about the current position of energy supply in the U.S. that depend on a deeply ignorant audience. Let’s take a look at a few:
This administration is focused on energy addition, not subtraction—a complete reversal from the previous four years. By the time President Trump took office for his second term, American energy had become more uncertain, more expensive and less reliable.
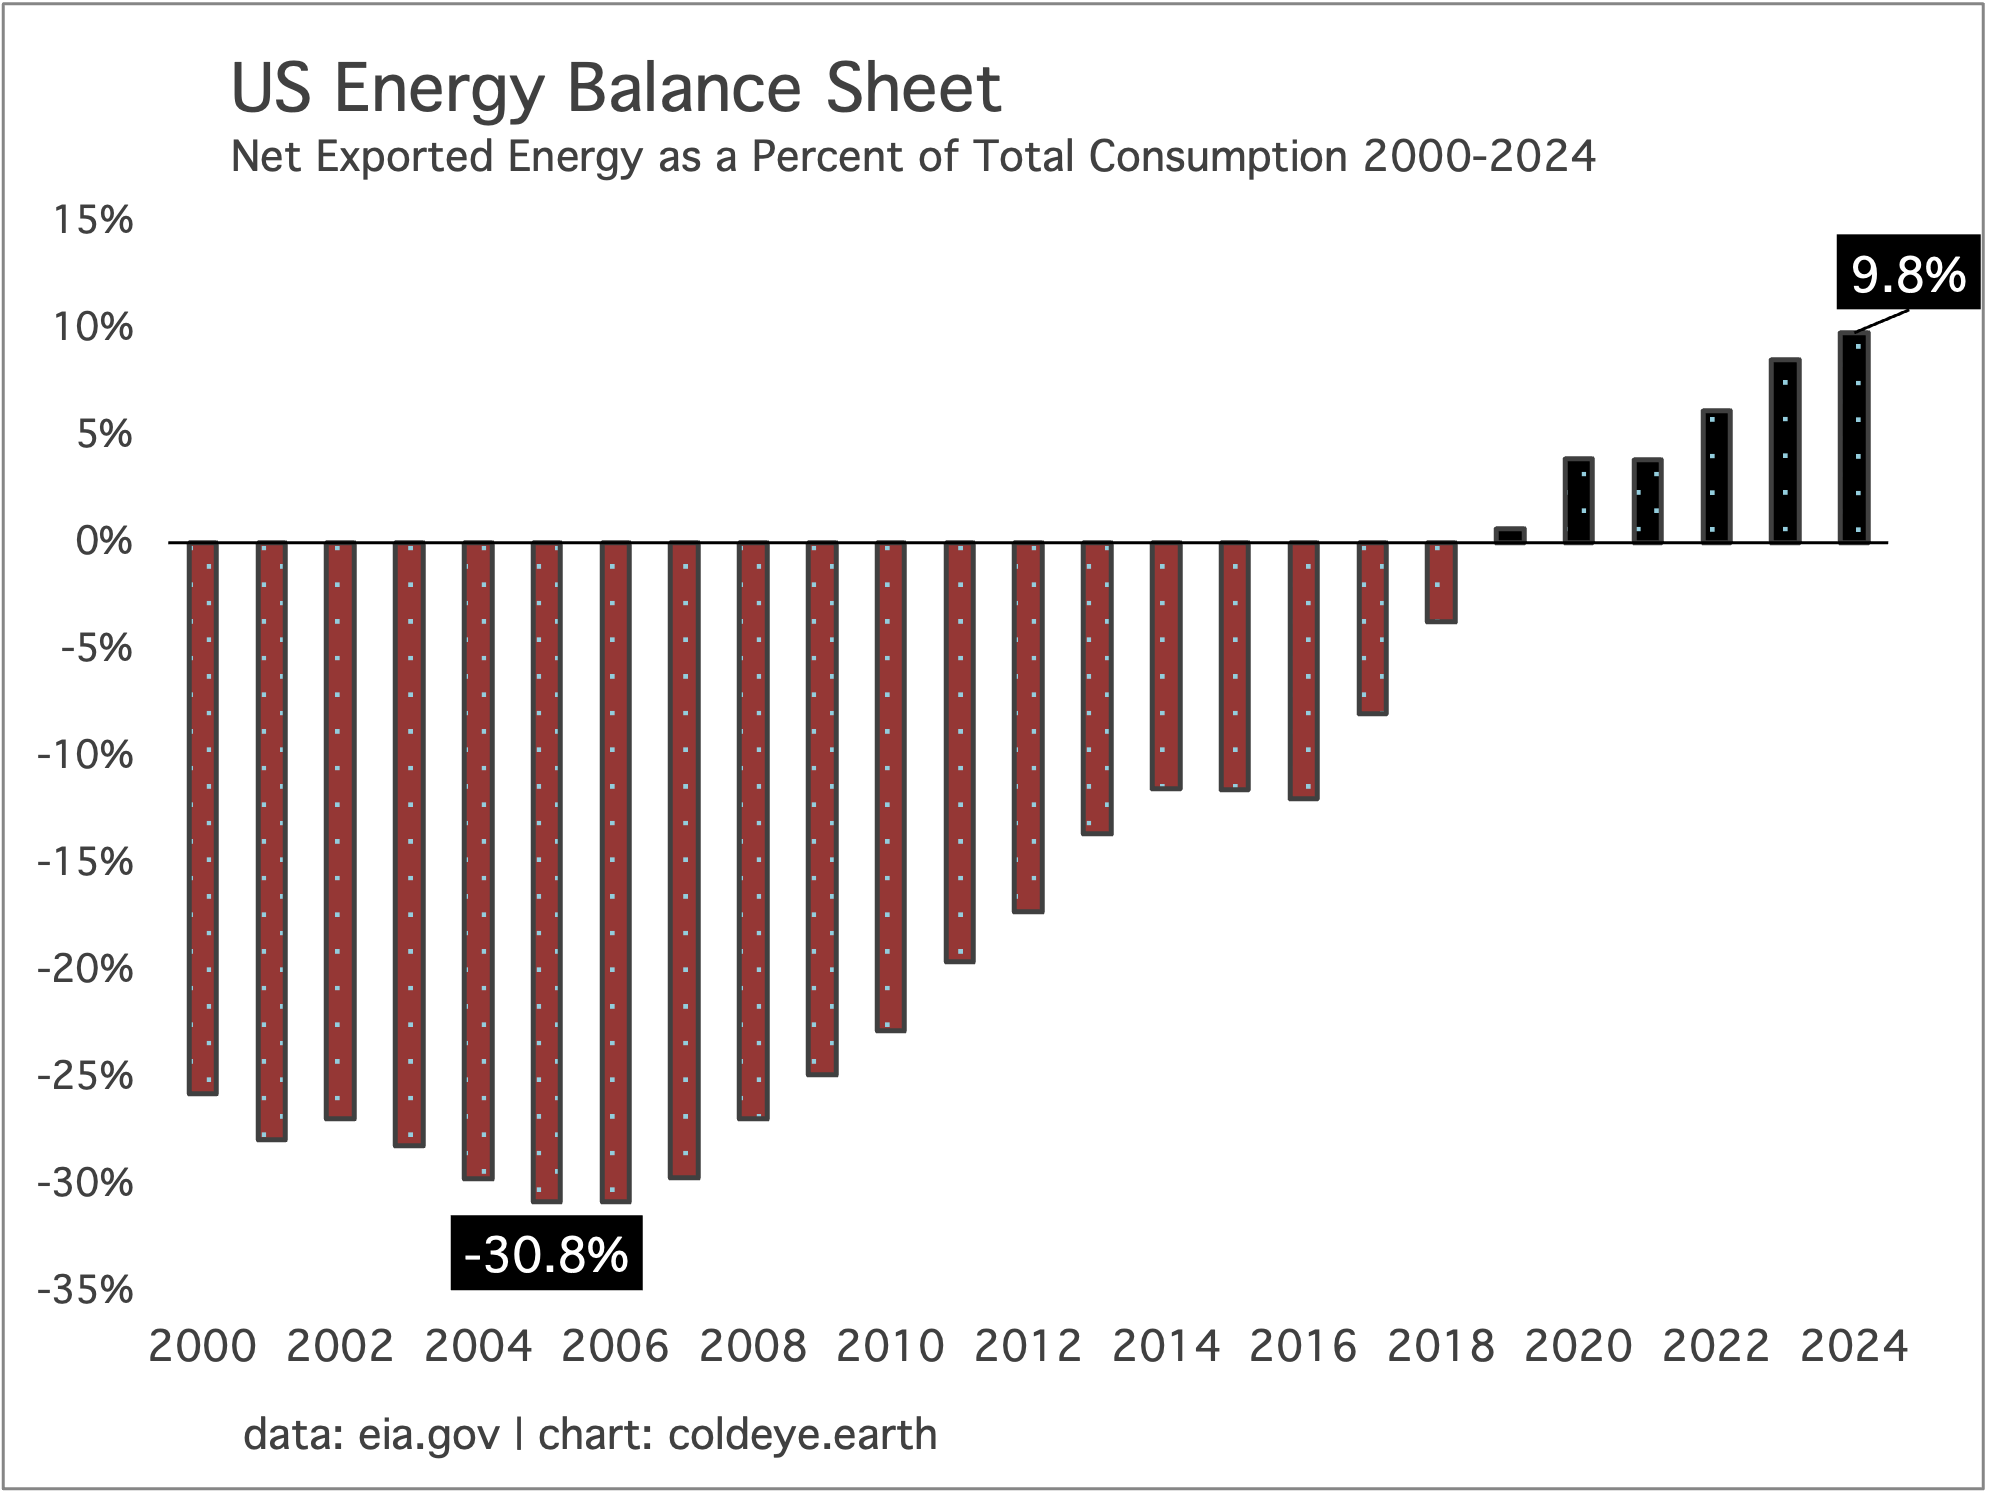
As informed readers know, American energy has been in terrific shape for over 15 years now, with output of wind, solar, natural gas, crude oil, and petroleum products hitting successive, relentless, all-time highs! The U.S. produces such a large volume of fossil fuels that we’ve been exporting the surpluses for years: coal to the non-OECD, natural gas in LNG form to Europe and Asia, and petroleum products to the world. Indeed, the country’s energy balance sheet started to repair itself during the last term of the Obama administration, kept going right through both the Trump and Biden administrations, and is now so robust that the U.S. is exporting energy on a net basis equal to 10% of the energy it consumes.
Wright’s op-ed continues…..
In the name of a single risk—climate change—the Biden administration launched a regulatory assault aimed at eliminating hydrocarbons in favour of so-called renewables. The results were predictable. By targeting our most reliable fuels, the previous administration restricted energy production and blocked critical-infrastructure projects like natural-gas pipelines. This resulted in higher energy prices and inflation, driving up costs for everything from gasoline to groceries. It weakened the resilience of the electric grid. It also made American manufacturing more expensive and uncertain, risking an exodus of businesses—meaning lost jobs and a shrinking tax base.
Note that the secretary cites no numbers to support his claims, because they literally do not exist. Natural gas and oil prices are now, and were under Biden, traveling along at 20-year inflation-adjusted lows. Milk and butter have done a better job keeping up with inflation than oil and gas. Why? Because North America has vast supplies of economically recoverable natural gas, and the learning curve of tight oil production keeps pressing onward, unlocking the marginal barrel of crude. The only supply-side-driven inflation in oil and gas occurred during Russia’s invasion of Ukraine, which realigned coal, oil, and LNG supply lines. That’s standard stuff in the geopolitics of energy.
• The cherry on top of all this nonsense is that tariffs on imported grid infrastructure equipment, and more recently of copper, along with the damage soon to be done to wind and solar, will not just push U.S. power prices higher, but will likely lift them above the general rate of inflation in the years ahead. Indeed, to be told that the new policies will be better for power prices than the old policies—by the same administration that wants to put a tariff on copper—is like being lectured to by either a child or a madman.
Further reading:
The Spectacular Folly of Donald Trumps’ Copper Tariffs
Power Prices Are Expected to Soar Under New Tax Cut and Spending Law

Among the many resource constraints facing U.S.-based data center growth is plain old water. The cooling demand for data centers is starting to reveal itself, and this has begun to seriously disrupt local water resources in multiple states, like Georgia, as was covered recently in The New York Times. In a closer study of data center water demand, the University of Oxford showed that more than 40% of the electricity requirements of data centers is actually due to water cooling, not the actual running of GPU clusters. Though they certainly haven’t reached the same footprint, this makes AI-led data centers not dissimilar from nuclear power plants, which are also critically dependent on cooling.
Cold Eye Earth is quite supportive of AI development and the productivity gains it will confer on society, but let’s be sober and realistic: this subset of the tech industry is starting to impose a number of externalities onto “the commons,” and it’s not a pretty portrait. Where data centers have been able to connect to the grid, they have placed undue pressure on local or regional power supply. Furthermore, where data center growth has been unable to plug into the grid, standalone natgas turbines are now coming to the rescue, and through a loophole in regulations, they can run this way for a couple years while enjoying a suspension of normal emissions control. Given that we are still on the front end of AI-led data center growth, and that getting on to the grid was already hard, the proliferation of standalone turbine power is likely only getting started.
The Trump administration appears genuinely deluded, believing their policies have made the U.S. an attractive destination for manufacturing and industrial investment. One small problem: this supposedly attractive destination was just loaded up with tariffs (many of them complicated) and an array of associated rules about pass-through imports, materials content, and other complexities. Worse, the capricious and impulsive policy moves around trade are frightening. As most have asked rhetorically, how does a business plan around such uncertainty? You can’t, and that’s the problem.

What’s particularly frustrating is that the U.S. evolved to have globally competitive electricity rates, at the commercial level, as a result of Non-OECD power rates drifting upwards for years while its own rates were more stable. Note, for example, in the above chart that the U.S. (faint purple) has been closer to India (yellow) and more competitive than the EU (faint yellow) or big manufacturers like Japan and Germany. (Source: IEA Electricity 2025.)
It’s the opinion of Cold Eye Earth that this was a component in the success the Biden administration had the past few years in attracting large flows of foreign capital and investment to the U.S. under various legislative actions, which drew everything from semiconductor to battery manufacturing to U.S. shores. Now we get to see what happens when you FAFO, putting all those good things at risk.
Growth of wind and solar last year covered exactly half of the total global increase in electricity demand. As discussed in the last letter, one could add generation from hydropower, nuclear, and biofuels to boost that coverage—but each of these are tricky. The only legitimate renewable category here is hydropower, which is increasingly affected by climate change, and is hard to model or forecast. But if you wanted to add it to the mix, its contribution would lift wind+solar+hydro from covering 50% of the total global demand electricity increase to 65%.
How does this issue of coverage look, across other domains? Here is a table showing the word, and its three biggest economic markets/countries, and how each performed last year.
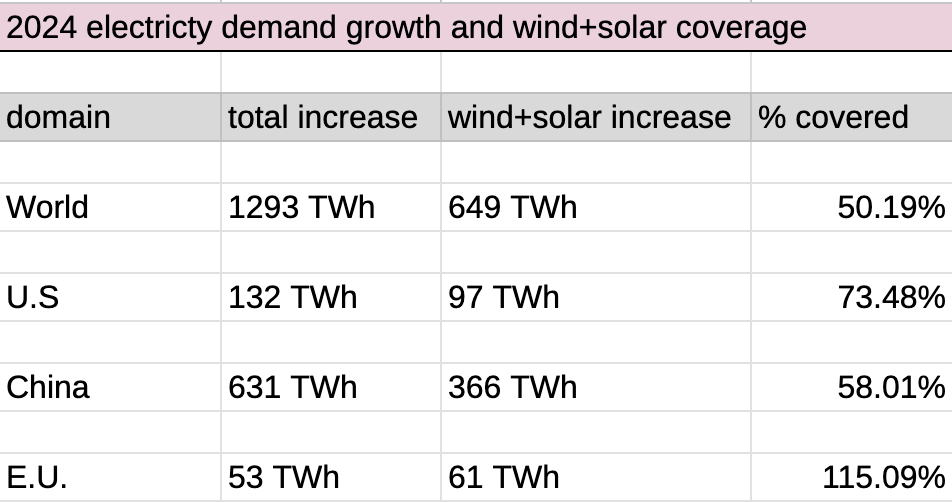
If we use the world as a baseline and its 50% coverage from wind and solar, there’s much to celebrate here as all three big domains exceeded that benchmark. While the E.U. is impressive in percentage terms, and the U.S. once again did well, the notable data point here is China’s 58% coverage, given that China is the world’s industrial manufacturer; is still moving through an industrial revolution; and generally posts robust GDP. China grew by 5.0% last year, while the U.S. grew 2.8%; and the E.U. just 1.0%. Needless to say, if the world’s economic growth plodded along at 1.0%, it would, on balance, be alot easier to get fossil fuel growth under control.
While it’s the view of Cold Eye Earth that the world will eventually cover 100% of new electricity demand with wind and solar, if we take a clearer look at current projections we see that we are on that path directionally, but at a pace that just gets us there, by the end of the decade. The world is growing too fast, and demand for electricity—boosted by energy transition—is rising quickly as a result.
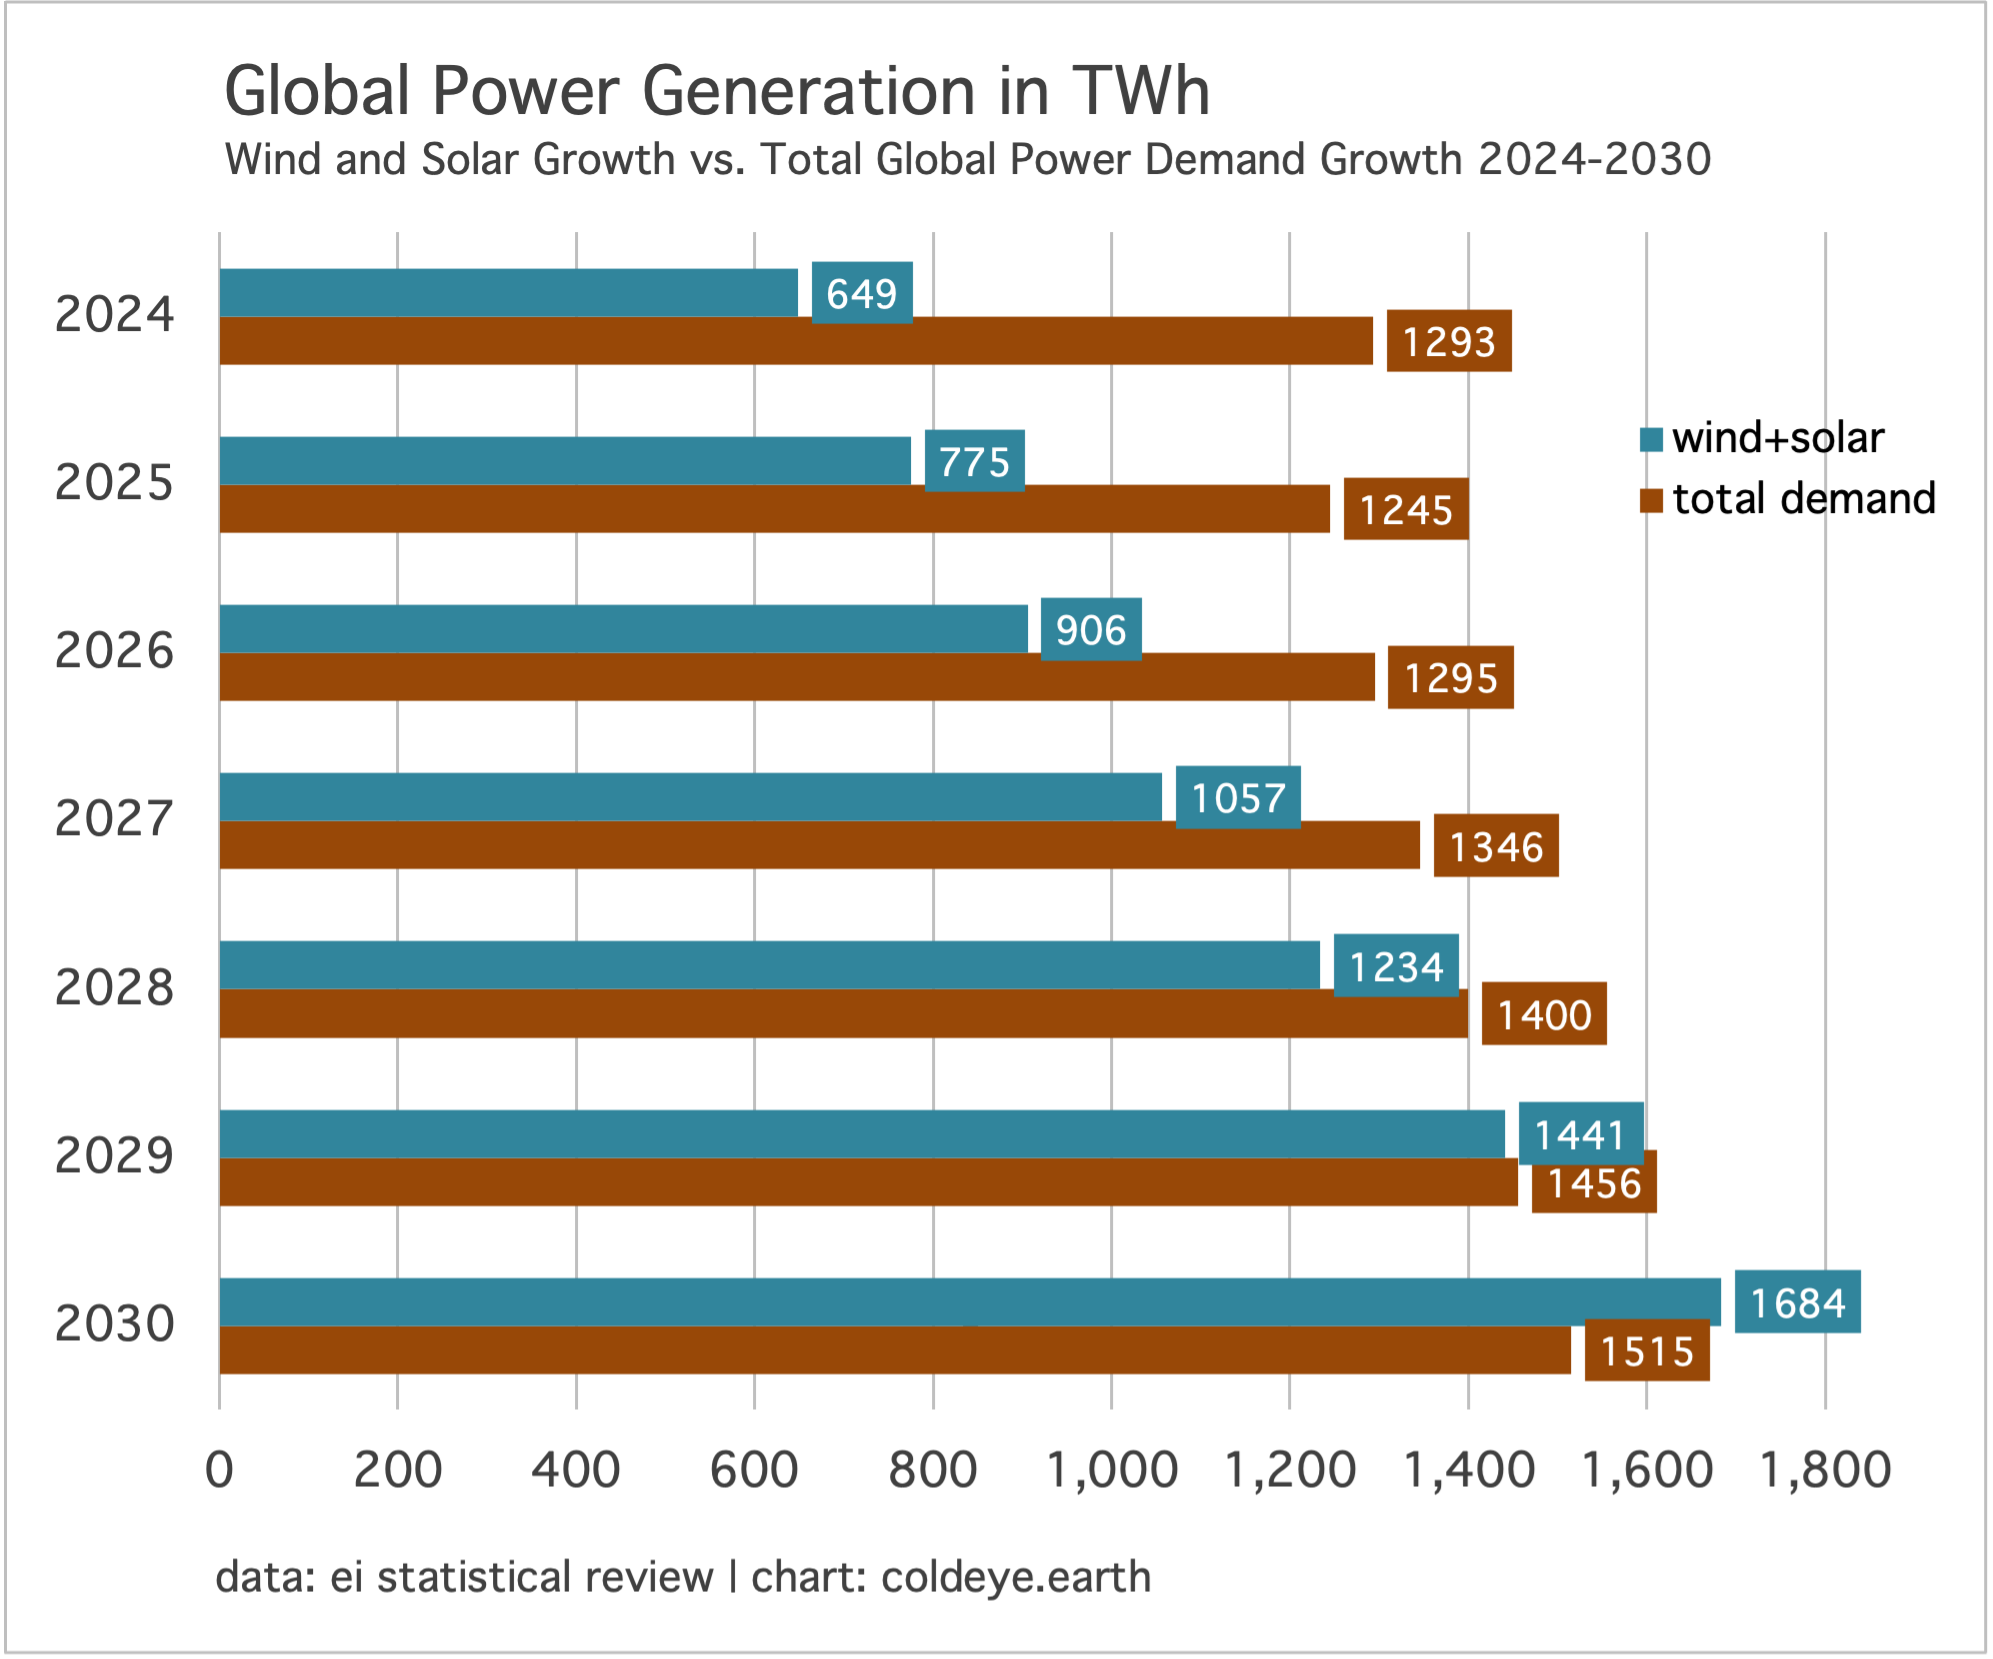
We’re also discovering that the growth of wind and solar is not hard to model, and has been rising a fairly dependable 16% to 18% a year for a while now. Accordingly, after reviewing past charts and depictions of these various growth trajectories, it may be helpful to have a histogram chart that depicts the advance each year made by new wind and solar generation compared to the total advance of electricity demand globally. Here, we are working with the same growth rates as discussed in recent issues: 16.8% for wind and solar, and 4.0% for total demand.
• The modeled growth rate for wind and solar could come under pressure if the U.S. drags down the annual gains, from constrained wind and solar growth.
• We could certainly get lucky for a couple of these forthcoming years, through some combination of lower total demand growth, and even higher growth from wind and solar. Also, if nuclear power was able to find a growth path, that would also dampen the growth rate of fossil-fuel power.
• There is no prospect of peak emissions in global power, despite the popularity of that view. Maybe by 2029. Until then, the world will do just as it did last year: adding tons of new wind and solar, but also continuing to build new natural gas capacity.
• Overcapacity in China’s coal fleet remains the wildcard. This overcapacity has existed for a long while, and emerges during bouts of extreme cold or hot weather, or spikes in economic growth. If China chooses however, it can move the deployment of wind and solar into a phase of overbuilding. If so, that would begin to cannibalize existing power capacity. Overbuilding wind and solar is easier in China’s political economy than in the west, where private property enjoys greater protections. Just to say, it would be exciting to see at least one domain, and why not China!, overbuild to the point that it disrupts the power system.
—Gregor Macdonald