
Work Matters
Monday 14 June 2021


Oil prices remain quite firm, even as the international agencies gently dial back their demand forecasts. The price strength makes sense however, especially as we turn to the second half of the year. Travel is likely to accelerate, industrial applications will also strengthen, and commuting will be resurrected this autumn. The crude oil futures market cannot afford to misprice Q4, which is historically quite strong.
All this said, global demand is not on course (this year, at least) to match the 2019 highs around 100 mbpd. Thus, we are once again facing an oil market that’s challenging to describe. It requires some flexibility to understand that global re-openings means a fast demand recovery, while at the same time absorbing the likelihood that demand has finally peaked. More challenging still: envisioning a demand landscape that carries onward for years, oscillating around a flatline.
As far as the EIA is concerned, US petrol demand has indeed peaked. They said so once again in their recent STEO report. Next year’s demand will still not reach the 2019 highs. Indeed, US road fuel demand peaked years ago. But note the echo: while it will never sustainably rise again, it’s only fallen a little.
Two factors bear watching for 2022. First, the global economy is likely to be quite strong next year as it gathers momentum. This will of course put additional upward pressure on oil demand. Indeed, the IEA—which has held its 2021 demand recovery forecast to a bounce of 5.4 mbpd—now sees 2022 total demand matching the 2019 high near/at 100 mbpd. But strength in the economy will also mean the EV adoption curve will accelerate, avoiding (for the first time perhaps on a global basis) a significant percentage of ICE vehicles that would otherwise have hit the road.
The second factor will come through workplace and commuting changes, which are now likely to be sustained. Here, we should probably “fade” the idea that everyone will be offered new home or office flexibility. The percentage of workers and employers that go the distance on new workplace schedules is likely to be small. But it’s not zero.
A just published paper from the University of Chicago, for example, showed that hours expended by workers during last year’s work-from-home phase actually increased, while productivity decreased. At first glance, this would appear to spell doom for WFH prospects—until you look into the details. Productivity losses were weighted heavily towards those workers with children, while single workers fared better. One conclusion is obvious: children will be back at school fully in the years ahead, so any understandable productivity loss from having children at home will ameliorate. Work from home is a concept that’s now out in the open, and will not be put back so easily.
When Facebook announced last week it would be extending workplace flexibility to all employees, that was probably the loudest signal yet that WFH options are here to stay. As we learned during the pandemic, many global workers today wake at home, travel a long distance to work, only to sit down again in front of a computer terminal. Moreover, we have decades of data showing that commuting itself is a deadening experience that often interweaves itself into overall job dissatisfaction. WFH, even on a marginal basis, promises to change these dynamics for the better. But more important still, future WFH represents another sizable hit to global oil demand, helping to kill off another pathway to growth, and the risk that global demand exceeds the 2019 peak for any length of time.
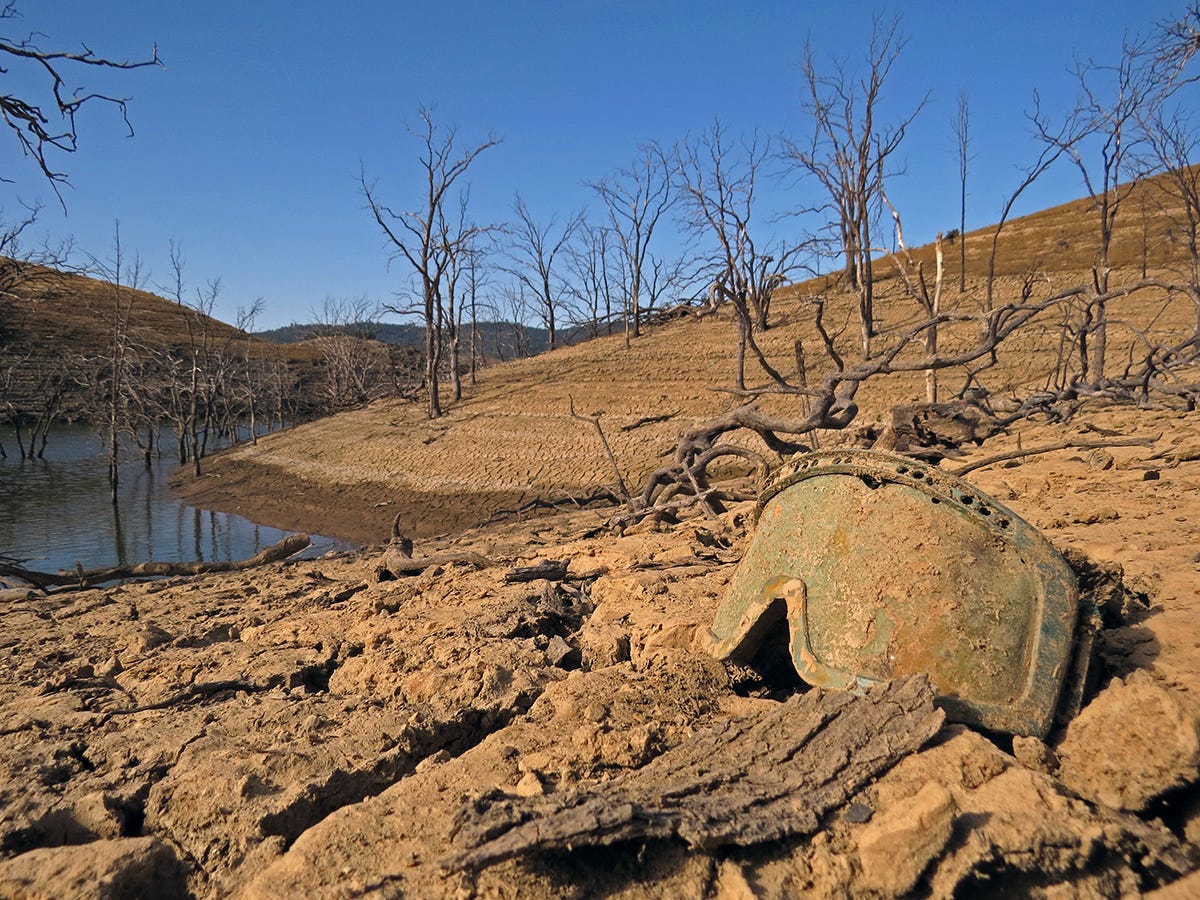
The drought in the western United States has probably been going on for twenty years, and may actually be a mega-drought, comparable to one last seen over 500 years ago. That’s the conclusion of a study released last year, which used 1200 years of tree-ring data. More sobering: droughts build strength over time, making them harder to break out of, or terminate. One immediate concern is how much the west depends on hydropower. As other analysts have noted, rising temperatures, dry conditions, and falling water levels tend to drive responses that include greater use of air conditioning, and greater demand for power—which often leads to rising natural gas consumption. The past several years have also seen fire and smoke events that have blanketed large areas, not just in California, but Oregon and Washington. And not just for a day or two, but for weeks. The New York Times also covered the story this week. Here’s a graphic from their piece.

The US has a much higher share of low-paying jobs than the rest of the OECD, potentially complicating the country’s efforts to pursue greater public investment. The observation comes from economist Jens Nordvig, of Exante Data. According to the OECD, nearly 24% of total jobs in the US are low paying, against an OECD average of 15.3%. That means long-timeline infrastructure projects may be challenged to find enough skilled labor, given that the US is carrying such a large load of unskilled jobs—mostly in food services. Looked at another way, however, this is precisely why the US should pursue broad, long term public investment programs. These are far more typical in the rest of the OECD, and undoubtedly account for part of the wage differentials. To put this bluntly, the US is overinvested in fast food production, and the strip mall economy more generally. Wage growth can never emanate from that segment of the economy, because it produces few useful increases in productivity. By contrast, cleaning out the pipes, so to speak, in the US water, transit, educational, and grid systems would justifiably throw off better wages as these efforts would lead to far better productivity and efficiency. America is discovering right now that workers are not keen to return to line-cook jobs at national burger chains. Maybe, just maybe, there’s a real signal there, worthy of our attention.
To see a dynamic version of the chart below, just click on it.

China new energy vehicle sales are on pace to reach 2.3 million units this year, an astounding 68% annual growth rate. As for the baseline, NEV sales were not exactly weak in 2020 as they overcame the pandemic’s singular hit to the broader auto industry. NEV sales were 1.367 million units last year, compared to 1.206 million units in 2019. A very solid performance in a bad year overall which saw industry sales slump by 8.2%. Electric vehicles in China, by contrast, merely took a 30 minute rest stop in 2020, before resuming their upward thrust. Just to remind, global ICE sales have peaked and China deserves all the credit.
The real news however is the market share growth of NEV, now coming into clearer view. As we have observed, the 5% level tends to be a take-off point in the adoption of myriad technologies and in 2020 NEV finally notched a 5.4% share, after stalling around 4.6% the two years prior. Now, with the total Chinese vehicle market on pace to sell about 26 million units in 2021, NEV are on course to hit an 8.8% share of the market. Thus, NEV have now reached their overt tipping point, just as they’ve done in the California market, and the European market.
In the chart below, note the figures for ICE sales: down over 4 million units since the highs of 2017.

Yields at the long end of the US Treasury curve are pulling back from their highs, as the market comes to understand that the hottest part of the recovery is now behind us. While monthly inflation prints remain elevated, the growth outlook is normalizing and that has taken the yield on the US 10 Year from a high of 1.76% to 1.46%. While a reasonable case can be made that yields may start rising again—more slowly, but more steadily towards 2% over the next year—it may also be the case that rates have peaked for now. You will have noticed that a number of supply crunched commodities like lumber are well off their highs, and markets are probably correct that myriad shortages will ease. Accordingly, it’s going to be very tough for inflation readings in Q4 of this year to match the summer readings, and the base effect will only get tougher in Q1 and Q2 of 2022. The offset to this more benign view would be a very strong global economy in 2022 (a forecast we should probably favor) that probably keeps the US 10 Year yield from falling much further. Overall, however, the dire predictions of the inflationists are fated to expire as usual. Demographics, automation, software, and technology are every bit as powerful now as they’ve been the past twenty years.
Lordstown Motors burned through a lot of cash, and has now warned it may not endure as a going concern. Investors should have been savvy enough to pick through last year’s oeur d'oeuvres tray of SPACs, choosing only those names that had earnings or sufficient capital. Chargepoint (CHPT) and STEM (STEM) are two examples of post-SPAC companies moving forward now with solid growth. Nikola (NKLA) and Lordstown (RIDE) offer the opposing case. It is frankly amazing that NKLA still trades above pennies per share. Lordstown, meanwhile, is discovering how difficult it can be to undertake a hardware start-up. Most embarrassing is that within a 60 day period, Lordstown provided radically different updates to investors on its cash position. Current status: “we don’t have enough capital to start producing.”
Bloomberg NEF released its global EV outlook, and raised its EV adoption guidance by the largest amount in five years. BNEF now sees global EV passenger cars rising from their 4% market share in 2020 (3.1 million units), to a 16% market share by 2025 (14 million units). Well, that’s a quadrupling of market share and a nearly 5X advance of units sold. Not bad. BNEF notes that divergences will be large, of course, between regions and picks China and Europe as market leaders—at least until 2025.
For a fleet perspective, which aggregates on-road EV, BNEF helpfully lays out that over 50 million passenger cars, and nearly 6 million EV buses and commercial vehicles, will be on-road by 2025. On an absolute basis, however, what’s quite astounding are the millions of two and three wheeled EV due to accumulate in the years ahead. The world will have added nearly another 75 million of these vehicle types by 2025. That represents a very large hit to oil growth, indeed. | Electric Vehicle Outlook 2021.

First Solar is expanding capacity, and will build another production plant near existing property near Toledo, Ohio. The company has incrementally increased capacity in existing properties the past few years. The newbuild is perhaps an acknowledgement that the demand pipeline is strong enough to take capacity to the next level. While First Solar remains a small player in global PV production it may be playing the tailwinds correctly here, as ethical issues and trade practice concerns continue to mount over Chinese panel production. There’s been a lot of aspirational talk about getting domestic green energy manufacturing started in the US, and First Solar may be playing its cards right. The company produced at an annual rate of nearly 8GW in Q1 of this year, and intends to add 3GW more capacity with its new plant.
After falling 11% in 2020 energy related emissions will recover by about 6% this year, according to the EIA’s latest forecast. As for next year, EIA estimates emissions will advance by another 2%. This won’t take emissions back to the 2019 highs, but the recovery is fairly strong. The last few years have seen reasonably good progress but rapid closures of coal fired power plants and the plateau in US road fuel demand have mostly accounted for the emissions decline. The challenge now, however, is to put together fresh new blocks of decarbonization. As The Gregor Letter has pointed out, the US is simply not going to open up fresh decarb gains unless it does something more forceful about the existing auto fleet. | The chart below is complete through 2020.

Innovation will not stop, and we should remain aware that creative approaches will continue to flower in clean energy. A new offshore wind design has emerged out of Norway that’s intriguing for how it might maximize surface area, using a greater volume of smaller turbine blades. Stitched together into a massive wall, the design may gain its edge less through surface area optimization, and more through lower deployment costs. The company, Wind Catching Systems, makes just those claims in its design release. Just to note: engineers globally continue to work on new, offshore wind designs that rearrange the deployment sequence in creative ways. Even if the offshore wind turbine largely retains its basic design, we can probably expect that new methods for their deployment will increasingly be absorbed into practice.

—Gregor Macdonald, editor of The Gregor Letter, and Gregor.us
The Gregor Letter is a companion to TerraJoule Publishing, whose current release is Oil Fall. If you've not had a chance to read the Oil Fall series, the single title is available and you are strongly encouraged to read it. Just hit the picture below.
