
Doldrums
Monday 4 March 2024


Generation from combined wind and solar grew at just 3.75% last year in the US, its slowest pace in decades. One can come up with explanations that might ease the shock of this single year performance, but frankly, the world can no longer afford to have “down years” from any domain where higher renewables growth is achievable. Natural gas generation meanwhile once again exploited the poor showing, growing at 6.8%. That was a repeat performance, by the way, from 2022 when natural gas power also grew by 6.8%. Cold Eye Earth has been warning for over a year now that natural gas growth both in the US and globally is still competing hard in the market for new power. Until that trend is halted, actual emissions declines in global electricity are neither happening, nor are they on the way.
One of the more unhelpful trends in understanding the fight to decarbonize power is the proliferation of charts showing capacity additions to powergrids. Yes, one obviously has to build capacity to obtain generation, but the misinterpretation of capacity growth forecasts can seriously lead one astray from the only thing that matters: generation. Indeed, let’s demonstrate just how far astray. Below is a chart from EIA that was wildly popular early last year, showing that a great run of new solar and wind and battery additions were just ahead.
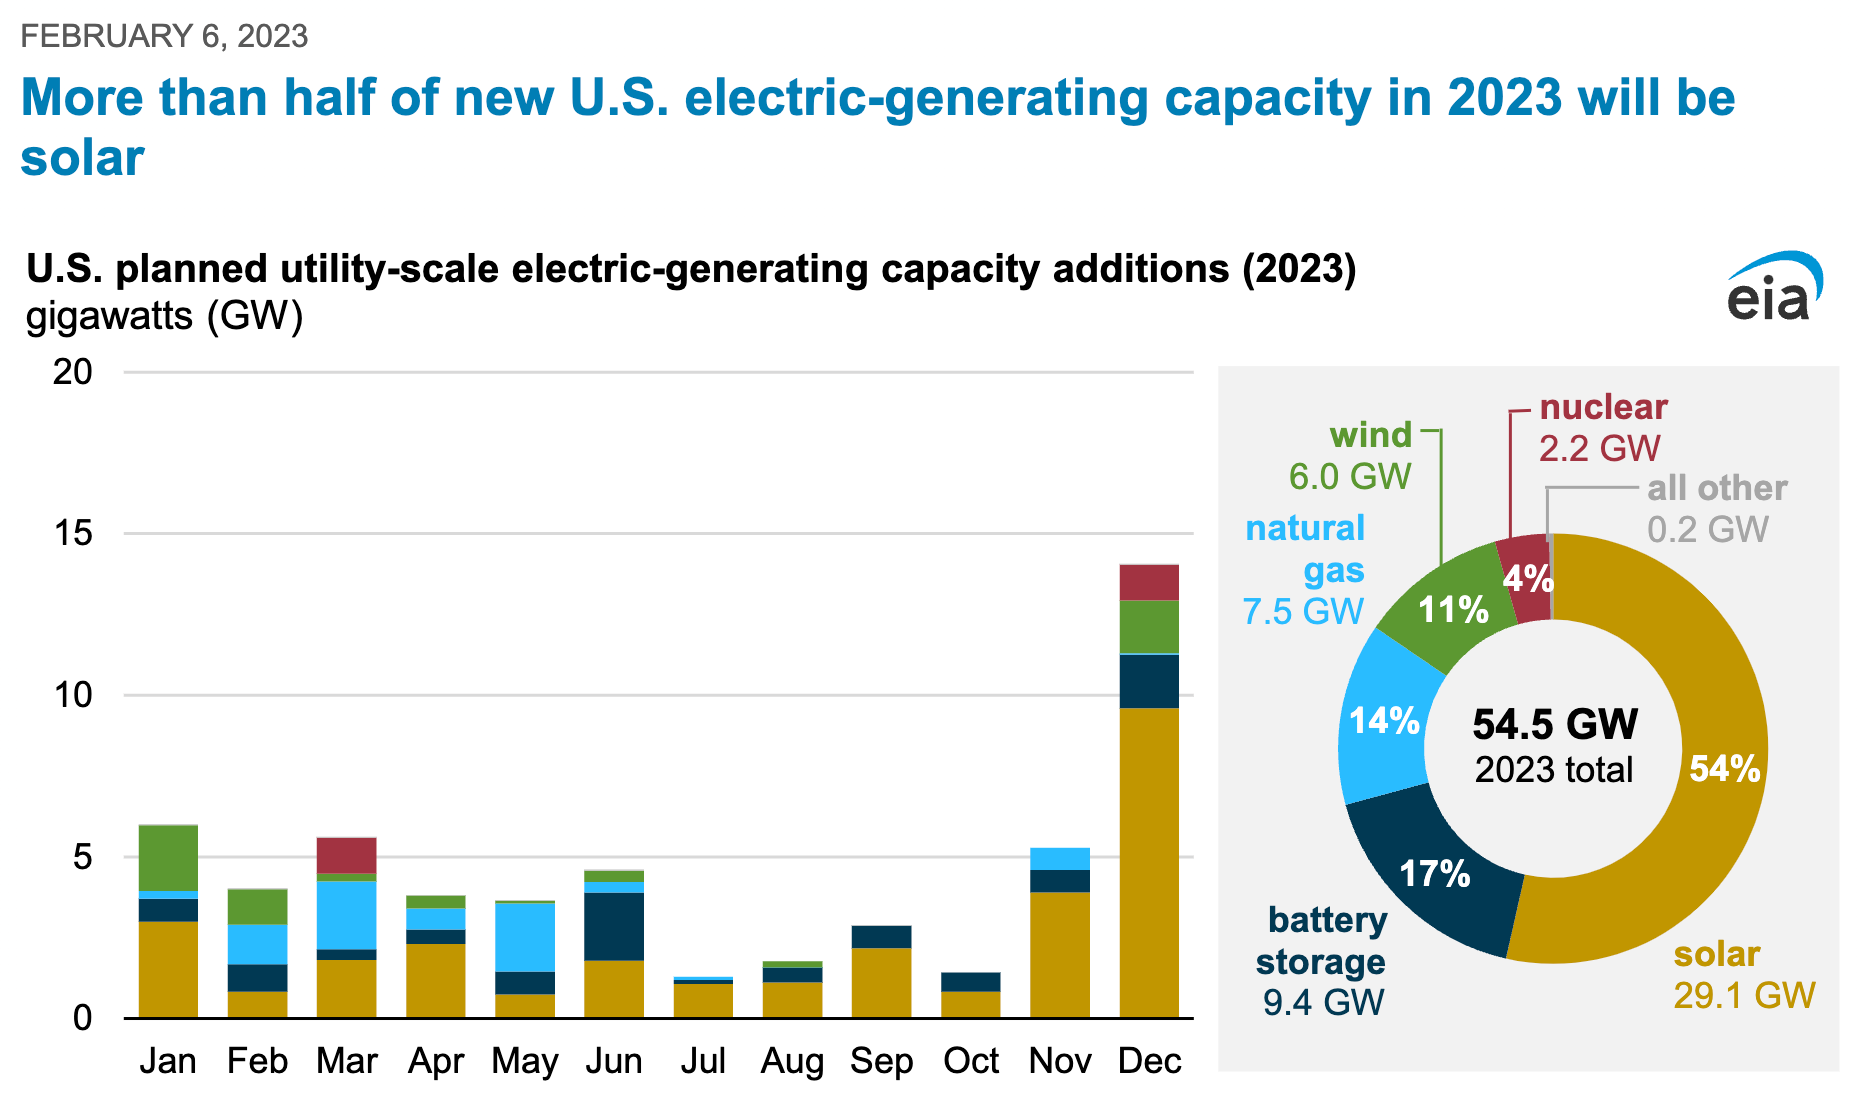
Now the results. Last year, power generation from natural gas grew by 115 TWh. Generation from combined wind and solar grew by 24 TWh. Yes, natural gas generation grew from a much bigger base. But, that is in fact a feature of the problem we’re trying to solve. Wind and solar are growing from a smaller base of course, and are growing fast. We can expect, for example, that the late-year capacity additions to solar in 2023 will show up this year in generation. Indeed, it’s a certainty that wind and solar growth will be much stronger this year. But constantly flogging the growth rate of wind and solar has become valueless, unless it’s measured against the ability to neutralize marginal growth in fossil-fuel power generation. As for capacity addition forecasts, they really only have one useful function: they allow us to estimate future generation growth using capacity-factor adjustments. For the general public, however, such charts are a nuisance.
Here is the recent history of combined generation growth from wind and solar, as measured in TWh:

According to the most recent polling, Joe Biden is on course to lose the 2024 election. Should this happen, a Republican administration would set a big course change on climate policy, turning away from clean energy and towards fossil fuel production. The question, therefore, is how much of that course change could they actually achieve? To understand the contours, let’s begin with the latest update, this time from The Wall Street Journal, on the massive impact underway in US manufacturing and investment from the grand suite of climate legislation.

The WSJ notes that a whopping 75% of the mining and manufacturing investments now rolling out will go to Republican controlled congressional districts. In the WSJ chart above, the magnitude of the growth has expanded quickly, even from a year ago, in the necklace that runs from Indiana and Ohio in the north, down through Kentucky and onward into Georgia and especially the Carolinas, where activity is now substantial. To undo the legislation driving this—the trifecta of the IIJA, the IRA, and CHIPS—therefore, would require new legislation. And on this point, it’s highly unlikely you could find the votes. Indeed, there’s no polling to suggest that a Biden loss would translate into rising GOP support in either the Senate or Congress. And even if a GOP Congress could extinguish or water down this legislation, they are not likely to do so. As Cold Eye Earth has remarked previously, the cage-rattling from the GOP about climate policy is not very aggressive, even now: and a decent analogy is to Trump’s pledge to repeal Obamacare in 2016. All threats. No action.
There is also a concurrent multiplier effect that’s starting to land. Large projects in the US have historically been burdened by spiraling costs and completion risk due to regulations. Accordingly, infrastructure professionals have predicted for decades that if the federal government finally started building and investing, it would unleash private investment too. While existing regulations remain a huge problem (yes, in a tragic irony, federal environmental rules are already clashing with many clean energy projects) it’s generally the case that when Uncle Sam is driving the bus, private capital feels more comfortable jumping on board. Former NEC Director Brian Deese recently cited this “following wave” effect, and the numbers are impressive, though not surprising:

Given that the US economy is doing so well, it’s counterintuitive to see the incumbent struggling so consistently in the polls. Yet, the New York Times and CBS have released a fresh round of polling, all showing that Biden continues to trail Trump. One theme that’s becoming clear is that, as Americans finally detach from the pandemic’s inflation experience, their sentiment towards Biden specifically remains quite negative even as their economic expectations are now improving. That’s quite unusual, and gathering evidence suggests that Americans think Biden is simply too old.
The infrastructure trifecta mostly covers fairly uncontentious areas like electric vehicles, grid transmission, battery plants, minerals processing, wind and solar, highways and bridges, and semiconductors. For example, The CHIPS Act is finding its way into states like New York, where a consortium made up of Cornell, IBM, and Rensselear Polytechnic are going to collaborate on semiconductor development. These types of programs are simply not going to be challenged. Indeed, one should add at least another year and a half to the process of business expansion, job creation, and economic development in long neglected regions from rural New York State to West Virginia before a new administration gets around to attacking these programs. By the time we’re deep into the year 2025, Congress will have absolutely no appetite at all to shut down battery plant construction in the Carolinas, or to pull back on infrastructure spending.
The risk to decarbonization during another Republican administration therefore would concentrate almost entirely on executive branch actions. No need to attack EV. Just relax or remove emissions regulation on new ICE vehicles. No need to fight wind and solar. After all, natural gas growth is still cruising along in the US. A second Trump term would mostly concentrate as usual on big symbolic wins, over line by line excisions from legislation. That would mean that LNG export capacity would grow uninterrupted, and oil and gas drilling would increase, despite the fact that the US hits new all time highs in liquids production every couple of months. A new administration could also take an axe to nascent, leading edge efforts like the Department of Energy’s hydrogen investments, and it could also cut back on energy efficiency efforts across other federal programs, mostly in construction. In other words, wherever there is existing legislation, current trends are safer. But every policy that’s controlled by discretionary agency rulemaking and initiatives would likely meet with a new lever. The EPA, the DOE, FERC could all be utilized to slow or halt decarb efforts. And if challenged, it’s unlikely the current Supreme Court would get in the way.
Global energy emissions rose more slowly last year, but again hit an all time high. According to the IEA, emissions advanced by 1.1% in 2023, after rising by 1.3% in 2022. Even more encouraging: the agency noted the average annual increase in global emissions the past decade was just a half a percent. That trend is well established now, as we come into peak emissions (and remember, that’s a process, not a single point in time). On a more depressing note: coal accounted for 65% of last year’s increase. Just to say, we are very late in the game now to still be experiencing global emissions gains from coal. King Coal was supposed to have been silenced last decade.
The IEA also updated the encouraging supertrend towards lower carbon intensity among developed nations. The chart below can also be thought of as a pretty good demonstration of the Environmental Kuznets Curve: when economies become wealthy, they begin to clean up their environment. Why does that happen? Many reasons, but it’s essentially the path to better economic growth.

The ongoing disaster that is Brexit is a reminder that advanced, educated, experienced societies can undertake the most inexplicable acts of self-harm. (Hint, hint: United States). Recent data shows that trade volumes have fallen five years in a row, according to this story from the FT. This is an outcome that could have been predicted by a first year student of economics. The heart of the tragedy is that EU membership solved decade-long problems of productivity and sticky high goods and services prices that had plagued the UK economy for decades.
Preview of coming attractions: if a new US administration were successful in killing domestic investment in infrastructure, lowering taxes, and raising tariffs, then the US too might face something similar in the years ahead.

There’s no slowdown in wind and solar growth in Asia, led of course by China. Better still is that solar is now cheaper than coal, according to recent analysis by Wood Mackenzie. Meanwhile, BNEF is out with its latest global solar outlook and forecasts that total global solar capacity growth this year could reach an astonishing 650GW. China will once again account for more than half of that growth.
—Gregor Macdonald