
Global Power
Monday 24 June 2024


The world is making a truly heroic effort to chase down the global electricity system with huge, new volumes of wind, solar, and storage. Growth of these clean technologies has been spectacular the past decade, and the storyline of good news keeps coming. Last year, for example, combined wind and solar generation grew by a total of 537 TWh which, frankly, is delightfully insane. If you are creating over 500 new TWh of clean power each year, even in a system that’s using 29925 TWh in total, then you are absolutely pursuing a transformation project.
The work of analysis, however, is to quantify the pace and scope of that transformation. Currently, the world has still not succeeded in catching up to the growth of global electricity using clean power alone. Unfortunately, this means that natural gas and coal continue to grow in global power. According to just released data in the EI Statistical Review, both fossil fuels are continuing to make new all time highs. We remain, therefore, in phase one of the energy transition. In phase one, we are locked into a fierce battle to cover 100% of total demand growth with clean sources. We are trying hard. But each year, we never quite get there.
Let’s illustrate with a partial view of the problem. In the chart below (interactive on the web), combined wind and solar generation has grown five-fold over the ten year period from 2013 to 2023, rising from 774 TWh in 2013 to 3967 TWh in 2023. But coal in global electricity continues advancing. Coal growth has absolutely been slowed way, way down by the growth of wind and solar around the world. But 2013, as it happens, was supposed to be the peak of coal consumption (not just in global electricity, but in total usage). Instead, coal slowly rose back up, matched its old high, and has now exceeded those previous highs. Last year, despite the amazing growth of combined wind and solar, total system growth advanced by an even larger amount, and thus the world had to call again on coal, which grew 188 TWh to a new all time high of 10513 TWh.
When the growth of clean power sources continues to make new all time highs, and fossil fuel power sources stop growing, then we will finally land in phase two of the energy transition. But phase two typically needs more time to unfold and languish before phase three can actually begin, with its outright declines. That’s why forecasters who insist on calling peak emissions in global power generation each year are making an easily avoidable error. Forecasters should generally wait until phase two settles in for a while, before stabbing away repeatedly, trying to call the top. (For those with financial market experience, you will recognize how often participants similarly lose themselves, trying to call tops).
We can also expand the battle raging in phase one to include all the other energy inputs to global power. Last year was a typical mixed bag, for example, with oil falling, coal and natural gas rising, hydro falling, and nuclear rising. This allows us to line up the collective growth in clean sources against the same growth in fossil fuel sources. The good news: total clean sources growth accounted for 70% of total system demand growth of 737 TWh last year. The bad news: fossil fuel growth accounted for the remainder, and we don’t break out of phase one until the remainder is not only gone for a year or two, but durably gone for good.
Here is the table version of how each energy source either grew or declined last year in global electricity. Doing the math, clean sources summed to a net 516.3 TWh of growth and fossil fuels summed to a net 220.35 TWh of growth.

Cold Eye Earth previewed the release of this new data in the last issue, pointing out that while popular discourse understandably follows the good news of clean energy growth, insufficient attention is paid to the system itself: how fast it’s growing, how much new demand we’re throwing at the global powergrid, and how challenging it can be to catch up to that growth and overtake it, solely with clean sources like wind and solar.
Last year for example, total global power grew by a healthy 2.5%—pretty close to the historical rate of the past ten years. But few if any expect this rate to obtain over the next ten years. Although AI data center growth occupies the center of the current discourse, almost to the point of mania, the big demand growth coming is collective, and goes far beyond data centers to electric vehicles, and electrification of buildings and industry. So again, if you are confident that fast growth of clean power sources will overtake system growth, at least reckon with the fact that in 2023, clean power sources grew heroically from an increasingly high base, and it still wasn’t enough to catch total system growth.
Why is that? Here’s a handy framing: a small thing growing at a fast rate will indeed eventually catch up to a large thing, growing at a much slower rate. But that large thing will continue to pump out massive volumes of growth in absolute terms each year, even at a low rate, because it’s so damn big already. This is how, while growing “at just” 2.5% each year, the total global power system advanced by 737 TWh last year. And, why its future growth rate matters at least as much if not more than the stellar growth of clean sources. Here is a chart of those possible futures:
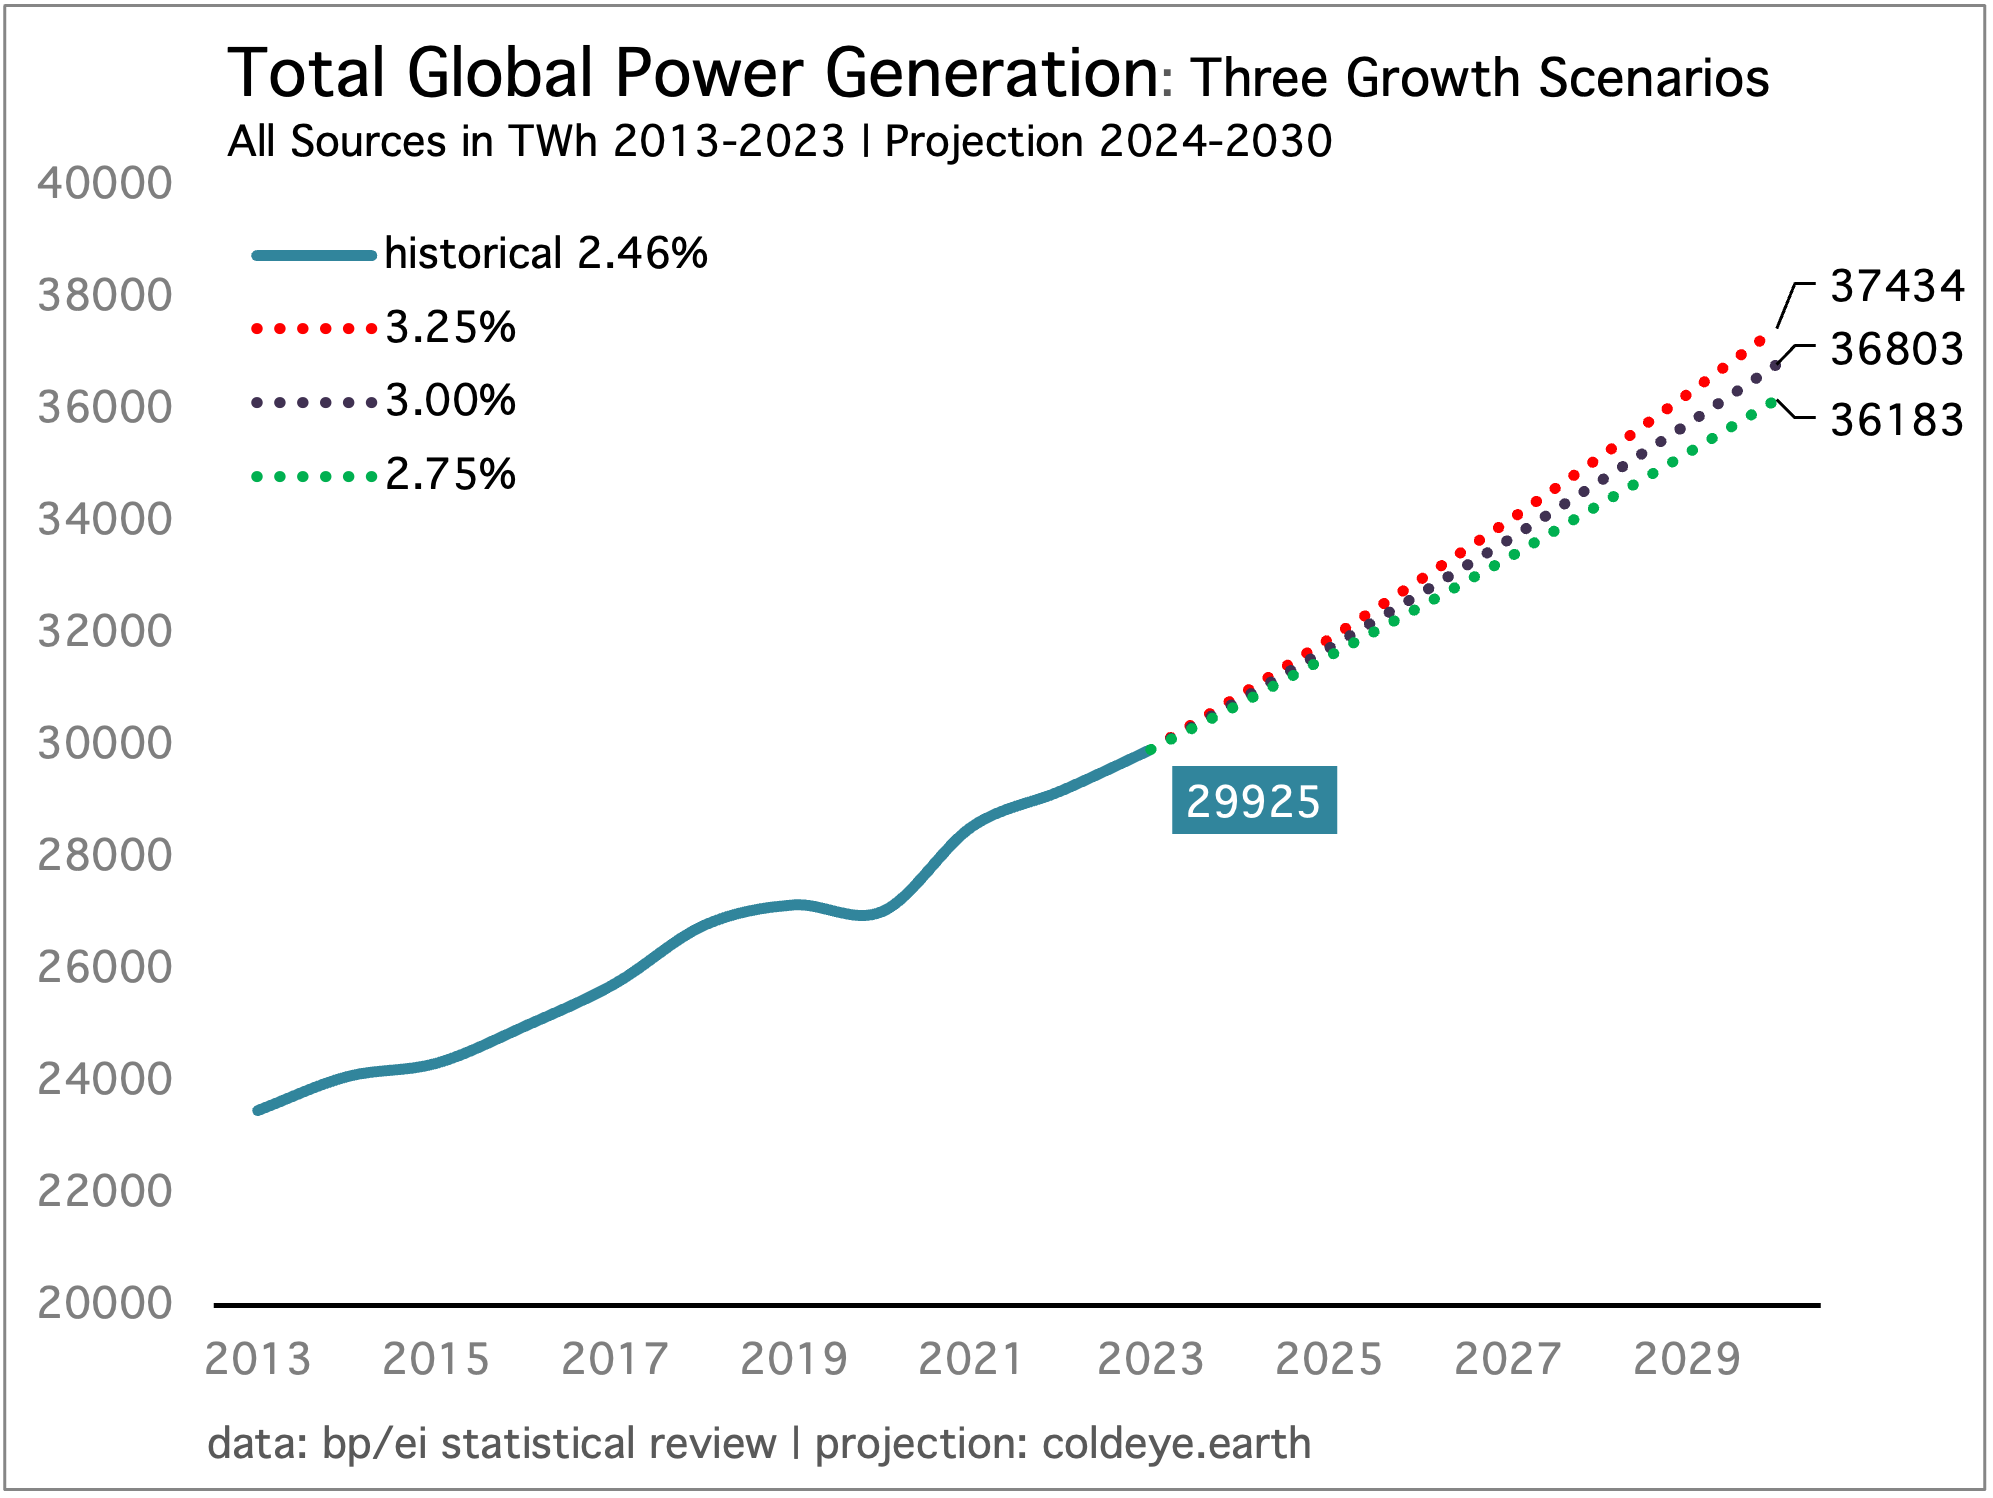
Analysis by Cold Eye Earth suggests that 1. if total system growth is constrained to the rate of 3.00% or lower to the year 2030, and, 2. if combined wind and solar growth continues at the current pace, then fossil fuel growth could indeed be finally halted in global power as almost certainly by 2030. Other factors however include 1. whether global nuclear generation does in fact grow as agencies like the IEA predict, and 2. whether the volatility in global hydro generation settles down, and we get growth also from that energy source. Hydro power globally has been a drag on clean power growth recently, falling in 2021 and 2023.
If emissions from global power therefore are not likely to decline until next decade, then it doesn’t make much sense to be stabbing away now at trying to top-tick “peak emissions.” The global power sector is likely to sustain a peak level of oscillating emissions for several years, before any decline sets in. This is yet another way of understanding that calling for peak emissions has very low utility.
So, what to do? First, stop publishing wish-casting pieces like this one published by the IEA last year, dangling the prospect that global emissions in power were about to be covered for three years straight, through 2025, by clean sources. That forecast just got trashed by the 2023 data released last week in the EI Statistical Review. Relatedly, it would help if publications didn’t credulously report think-tank calls for peak emissions. This NYT climate letter is a particularly egregious example, using phrases like “monumental shift” when the article itself doesn’t bear that out. Second, don’t publish endlessly rah-rah articles about clean energy growth in global power without addressing also the system growth rate. Finally, spend more time identifying the laggards in the global solar buildout. India, on a per capita basis, is the furthest behind of the big countries, and is dragging down the world’s potential. India grew combined wind and solar generation last year by just 30 TWh. The EU, with a population with a bit more than 1/3 of India’s population, grew combined generation by nearly 100 TWh.
Surely one of the most vexing energy stories of the past decade has been the resurgence of global coal growth, long after coal’s obituary had been written. The forces arrayed against coal have been powerful, and yet, coal growth survives. The US and the EU have massacred coal share in their power systems; global wind and solar growth is ferocious; and natural gas adoption through globally traded LNG has risen. And yet… coal growth survives. It’s a confounding story, with a terrible outcome.
Coal like other fossil fuels enjoys the protection conferred by path dependency. The operational expression of path dependency is that our world is set up to easily deliver the next unit of coal, natural gas, and oil. Most consumers in the developed world live within 10 minutes of a petrol station, and if you need oil delivered to your home for heat, you need only make a phone call. At the other end of the spectrum, every country in the world can order up cargoes of coal and LNG, also with a phone call. Moreover, many countries around the world have existing financial, labor, and policy structures that are embedded also into the coal system, strengthening path dependency further.
Global coal growth, at this late hour, is now largely restricted to China and India. To illustrate, net coal growth globally last year advanced by 2.5 EJ. But China’s consumption advanced by 4 EJ (a 4.7% jump) and India’s consumption grew by 2 EJ (a 9.8% jump). So, despite coal consumption falling in many countries around the world (including Asia!) China and India are together keeping coal alive by moving steadily ahead from a large base. Again, big things moving slowly will generate huge gains in absolute terms. Path dependency in China is well embedded.
The global coal story also, quite obviously, has very little good to say about the race to top-tick global emissions, and especially peak emissions in China. Indeed, the 10 year coal plateau and resurrection offers a stern warning: peak does not mean declines are coming.

Emissions crashed in Europe last year, making for big, back to back declines over the past two years. Whether its oil, coal, natural gas, or road fuel, Europe has now advanced to phase three of the energy transition. Its peaks are well established, and are now in the past. From this point forward, the continent’s efficiency efforts combined with its continued deployment of wind and solar means that it’s steadily eating away now at fossil fuel consumption. Final observation: please notice that emissions largely plateaued from 2013 - 2018.
Uncertainty over the future path of global power growth is high. In the view of Cold Eye Earth, supply uncertainty in both nuclear and hydropower is becoming more important. Had hydropower not fallen so hard last year, clean sources would have covered so much more marginal system growth than the 70% contribution they notched in 2023. On the demand side, we are still growing at the historical rate around 2.5% but the risk that demand in global power bolts higher is real.
One of those factors that could swing annual demand higher, in an unexpected spike, is the need for air conditioning. You are likely familiar with the doom-loop scenario: summers get hotter, demand for AC goes higher, power demand to run the AC goes higher, and it becomes hard for all resources, not just wind and solar, to keep up. One conclusion from a UN report published late last year, Global Cooling Watch 2023, forecasted that global air conditioning could compose 10% of total emissions by 2050. The only possible optimism one could have about such a projection is that wind, solar, and storage will most likely be covering that demand by mid-century.

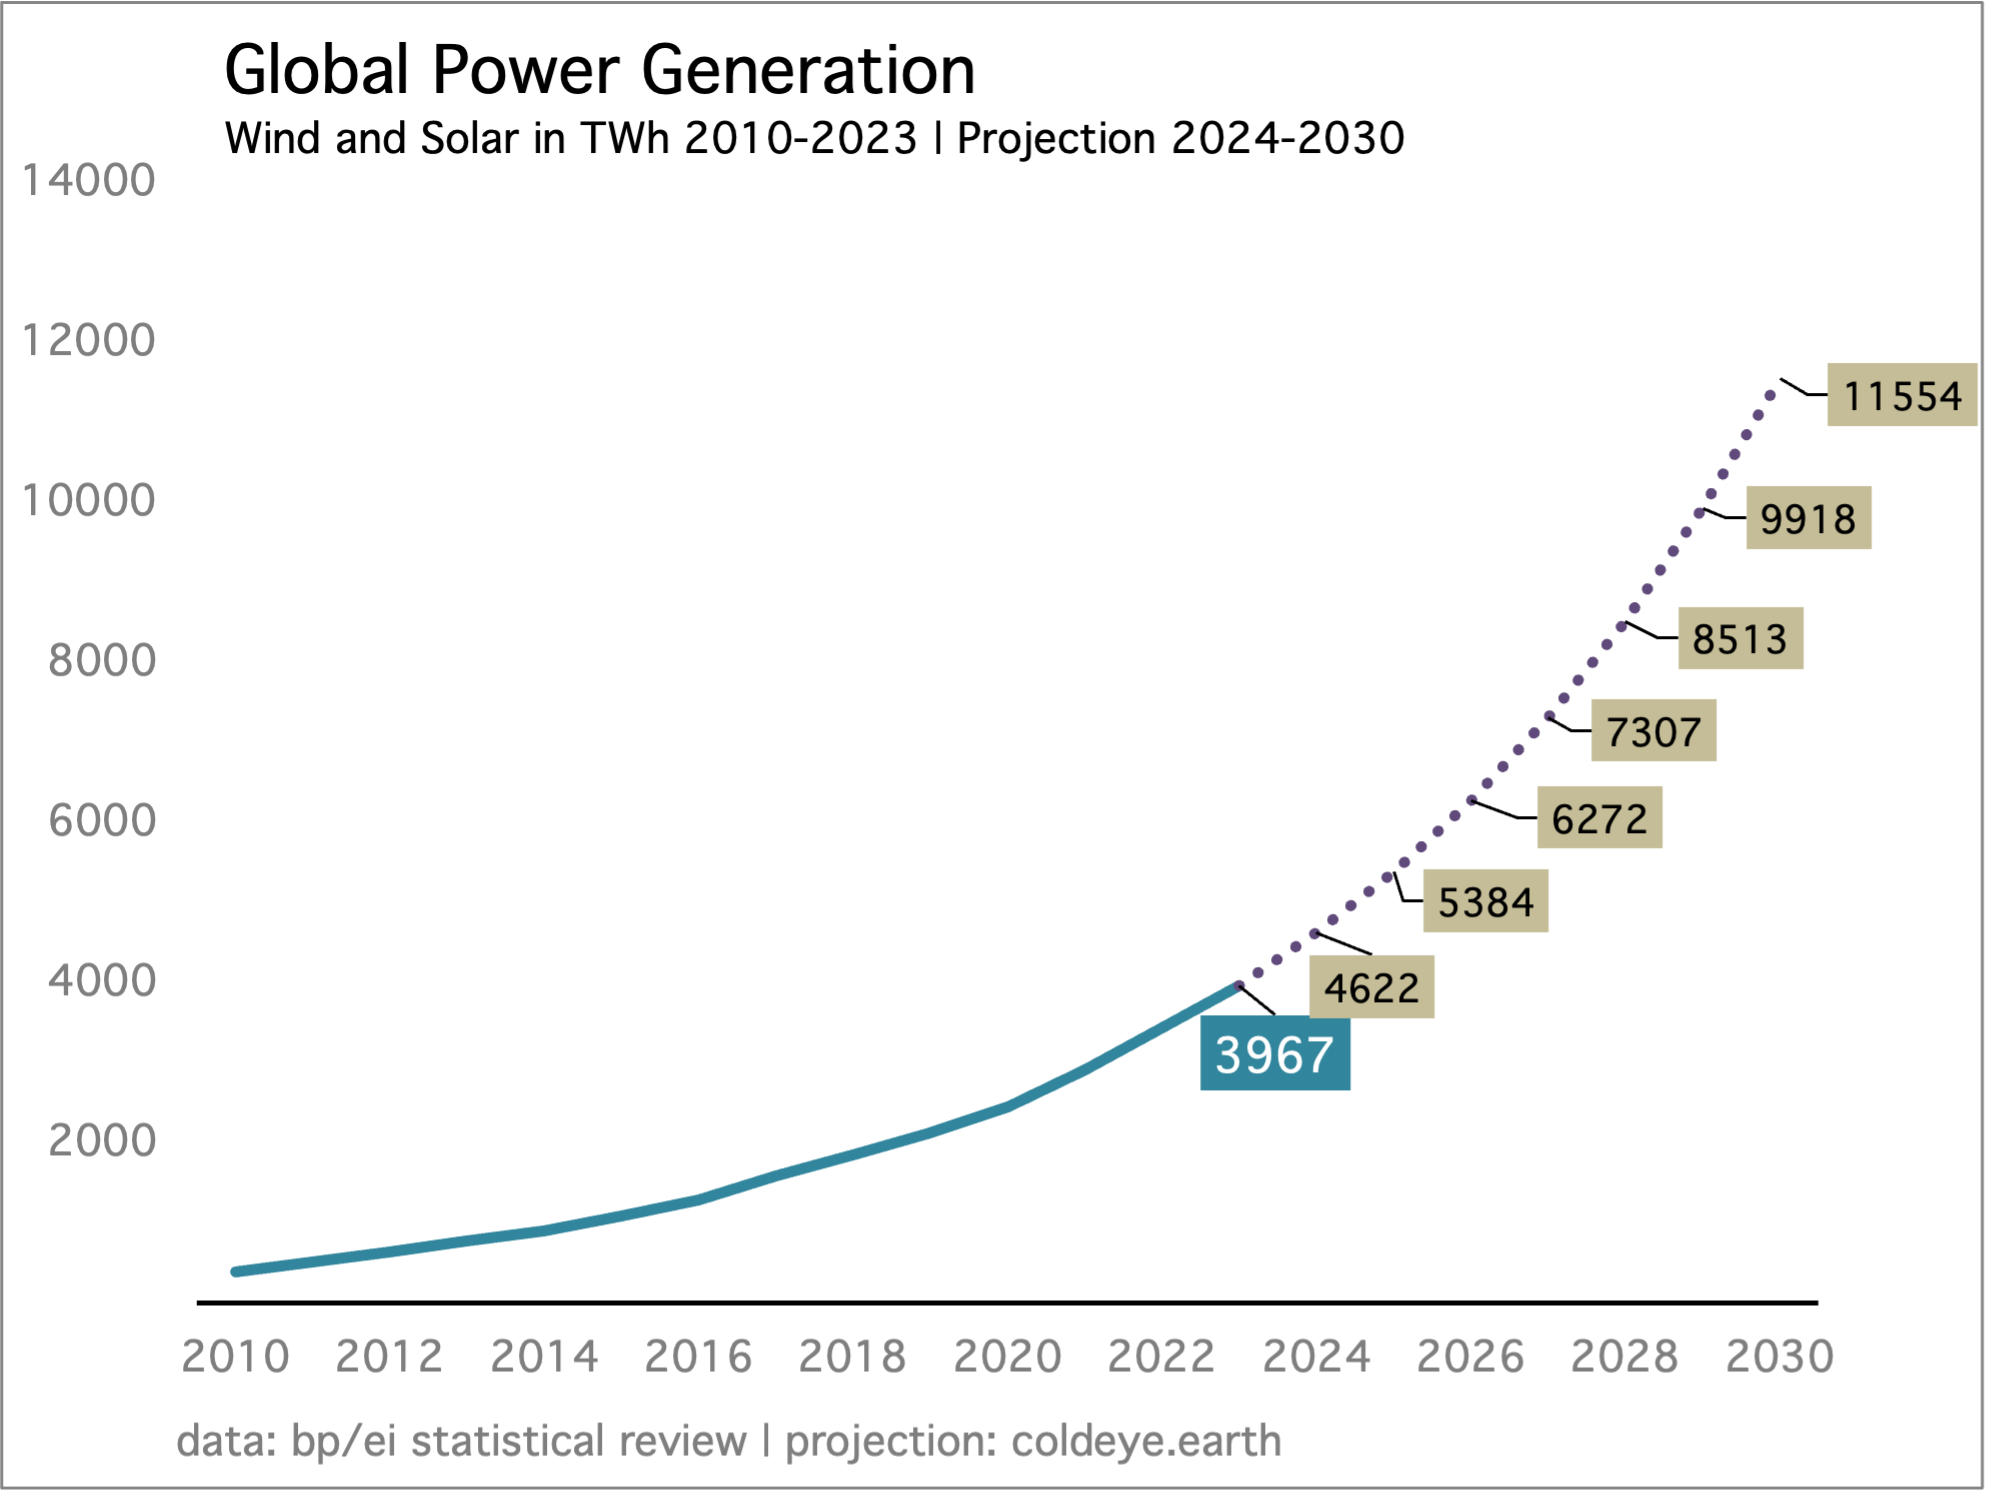
Wind, solar, and storage are now the undisputed leaders of global decarbonization, despite the fact they still need hydropower and nuclear to help them get the job done. Over the past five years, generation from combined wind and solar globally has advanced at an average annual rate of 16.5%. Very nicely, generation from the two clean sources advanced by 15.65% last year, demonstrating that the trailing five year rate has reasonably good predictive power. If that’s the case, it’s time to refresh the outlook for generation.
The chart below runs through 2023, and then applies the 16.5% growth rate to all years through 2030. Students of growth will recognize immediately the risk that, as the base grows, maintaining the trailing growth rate gets harder. So far, wind and solar are doing a good job to rebut that notion. But one wonders: when you see those additions in the later years, say, between 2027 and 2028, when combined generation is projected to grow 1200 TWh! from 7307 to 8513 TWh—can that really happen? Sure it can. But for the world to be adding that much new supply we will have to see solar and wind blossoming in domains where growth so far has been weaker: India, and Africa especially.
Overall, the prospect for decarbonization of global power improves slightly this year, because total system demand still has not made its jump, to either a 2.75% or a 3.00% growth rate. Notice how controlling this number becomes to the entire project of energy transition. If global power growth were to somehow move forward without jumping, then the annual disappointments in categories like hydropower don’t hurt as much, and the call on coal-fired power relaxes. In such a scenario, wind and solar have a better chance to steal the ball, and make a score. For now, the most reasonable projection that Cold Eye Earth can formulate is that emissions from global power will convert to a plateau sometime in the second half of this decade, and we will get our first shot at actual emissions declines from global power starting as early as 2029, or as late as 2031.
—Gregor Macdonald