
Faster Now
Monday 19 August 2024


Cold Eye Earth is raising its estimate of average annual global power growth to the 3.00% - 3.25% range, from the present year to the year 2030. The change comes after the IEA recently announced a new and dramatic forecast for consecutive 4.00% annual growth in global power for 2024, and 2025. Unfortunately, should the IEA be correct in its outlook, that rate of growth entirely forecloses upon the newly popular idea that emissions in global power will soon start to decline. The world is simply not on course to cover such a large expansion in global power with clean sources, despite the spectacular growth of solar.
The IEA forecast is, however, confirmation that one of the key pillars of energy transition—making electricity the new platform for growth—is working well. We do, in fact, want to see soaring demand for power as it also confirms one of the longest-running themes here at Cold Eye Earth: the next unit of global GDP is far likelier to be built on the back of the powergrid, rather than on the 20th century growth fuel, oil. The downside of this goal is that unless we cover all marginal growth with clean sources, then the world will do what it has always done by calling upon natural gas and coal especially, to fill the gap.
Previously, Cold Eye Earth offered three growth scenarios to best capture the accelerated growth rate that was likely to unfold from 2024 - 2030. Using the historical rate of 2.5%, growth was modeled in a low, middle, and high case of 2.75%, 3.00%, and 3.25%. That lower case of 2.75% is now off the table. Without a global recession or a geopolitical conflict, two consecutive years of 4.00% growth would have to be followed by a very weak five year run to 2030 to average out at 2.75%. Hence, the growth scenario chart is now more simplified, as it shows outcomes for both the 3.00% and 3.25%, as a probable range, along with a very high case of 4.00% sustained to 2030. Despite the bias of Cold Eye Earth to project higher than expected power growth to 2030, we’re probably not going to see 4.00% sustained over seven years. But, it’s instructive to see how that would look, if it happened.

The problem is that 3.00% - 3.25% is a total power system growth rate that may also be difficult to cover entirely by renewables. Indeed, for the past two years, Cold Eye Earth has been warning that a higher growth rate was inevitable, and the only uncertainty remaining was the time of its arrival. That moment appears to now be at hand. Over these two years, Cold Eye Earth has made the following points:
• Advocating for new nuclear. Cold Eye Earth has acknowledged repeatedly that wind, solar, and storage are the decisive leaders of decarbonization in power, and that no technology, including nuclear, can match their cost and speed to deployment. Case closed. However, nuclear in a junior role would be enormously helpful to the cause, and the world can’t rely on China alone to build some. We don’t in the West need to build alot of nuclear, nor should we tell ourselves that only nuclear can lead decarbonization. But we should build some new nuclear to maximize the capability of wind, solar, and storage to plow through all power growth, and get emissions into decline. Those saying we don’t need any new nuclear are wrong. | further reading: Portfolio Nuclear
• Highlighting the big number. In a world absolutely brimming with celebratory reports on the rapid buildout of wind and solar, Cold Eye Earth has argued we should be paying even more attention to total system growth. There’s a global daisy-chain of non-profits and think-tanks constantly pumping out the good news of wind and solar growth, which is often paired with repeated (and failed) attempts at forecasting peak fossil fuel consumption, and peak emissions. That is what might be called an attractive nuisance—hopium reels in the crowds, but never delivers on the promise. If the IEA’s latest forecast doesn’t convince you to direct your attention first to total power system growth, you are probably beyond reaching. | further reading: The Big Number.
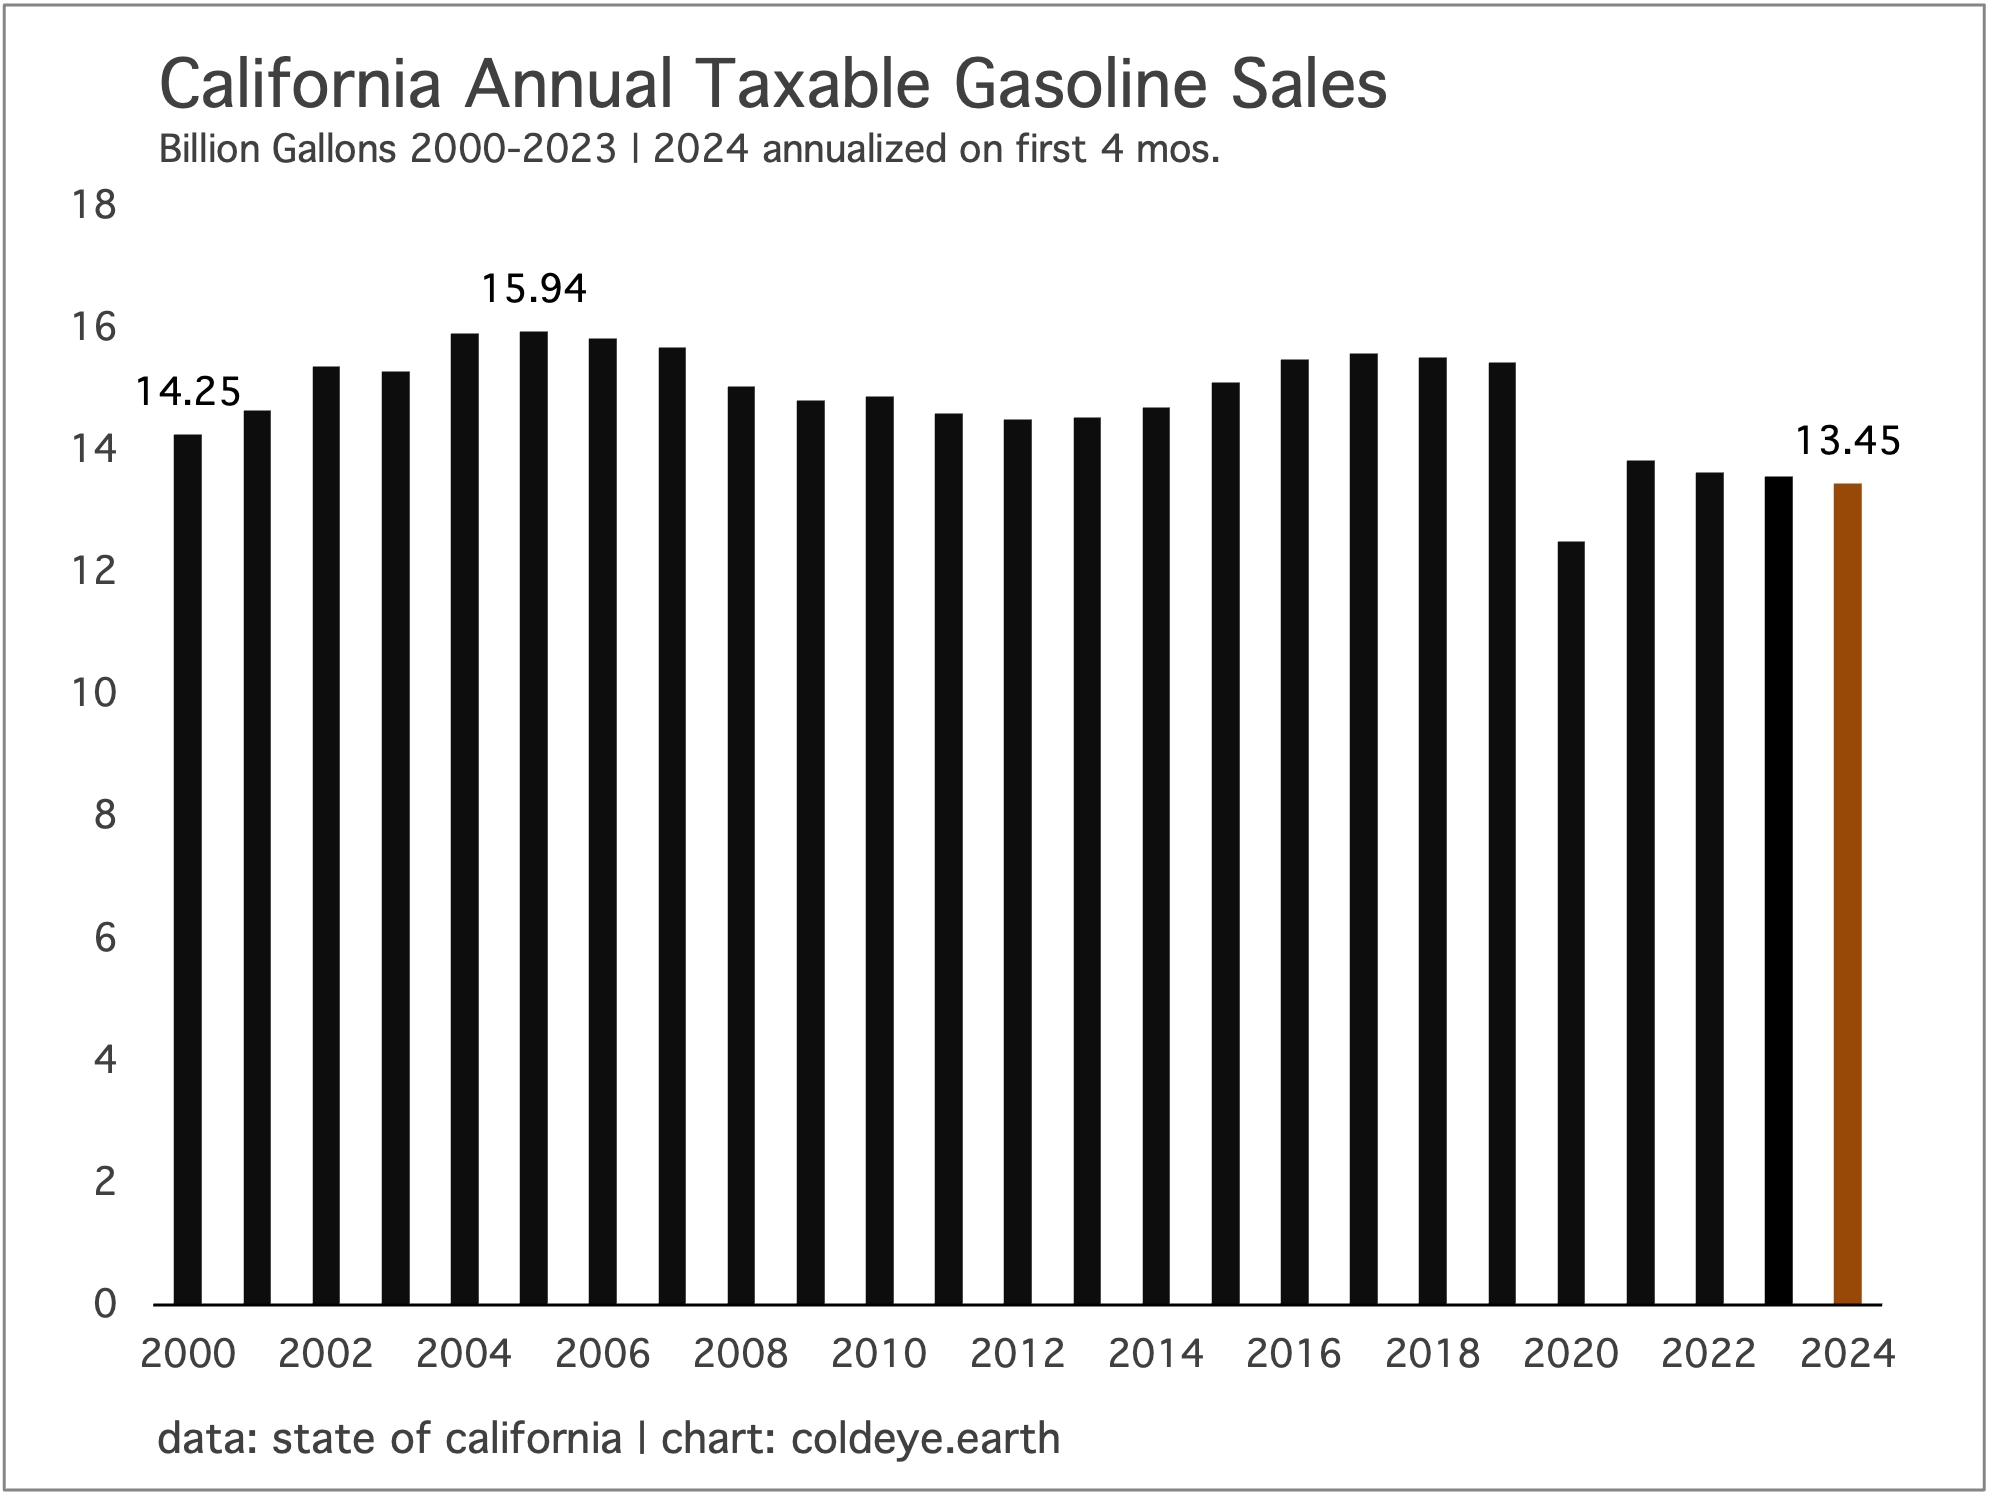
• The history of peak forecasting is awful. The road of energy analysis is littered with the bodies of those who called for peak supply, and now, peak demand. You can find peak natural gas, coal, and oil forecasts that go back decades. Constructively, most have given up on this project and accepted the sobering reality that the world contains not just vast reserves of recoverable fossil fuels, but more importantly, that humans are a wildly clever species, continually finding ways to economically recover fossil fuels with ever improving technology. Now we have a new, crowded trend: calling peak demand. This is not an unworthy project! But it must be undertaken with caution. Cold Eye Earth accepts the obvious in this domain—that OECD oil demand peaked nearly 20 years ago, that OECD coal demand is well past peak, that California gasoline consumption has now peaked, and that global oil demand has probably peaked but will oscillate for years and not decline any time soon. Mostly though, the world has a plateau problem—multiple examples of fossil fuel consumption that has stopped advancing, but isn’t declining either.
The world will not build enough new clean power capacity to force power sector emissions into decline this decade. At the new, stepped up growth rate of 3.25%, the world would need to bring on enough additional wind and solar—and nuclear and hydropower—to not just cover marginal system growth, but to actually start crowding out existing, dirty generation.
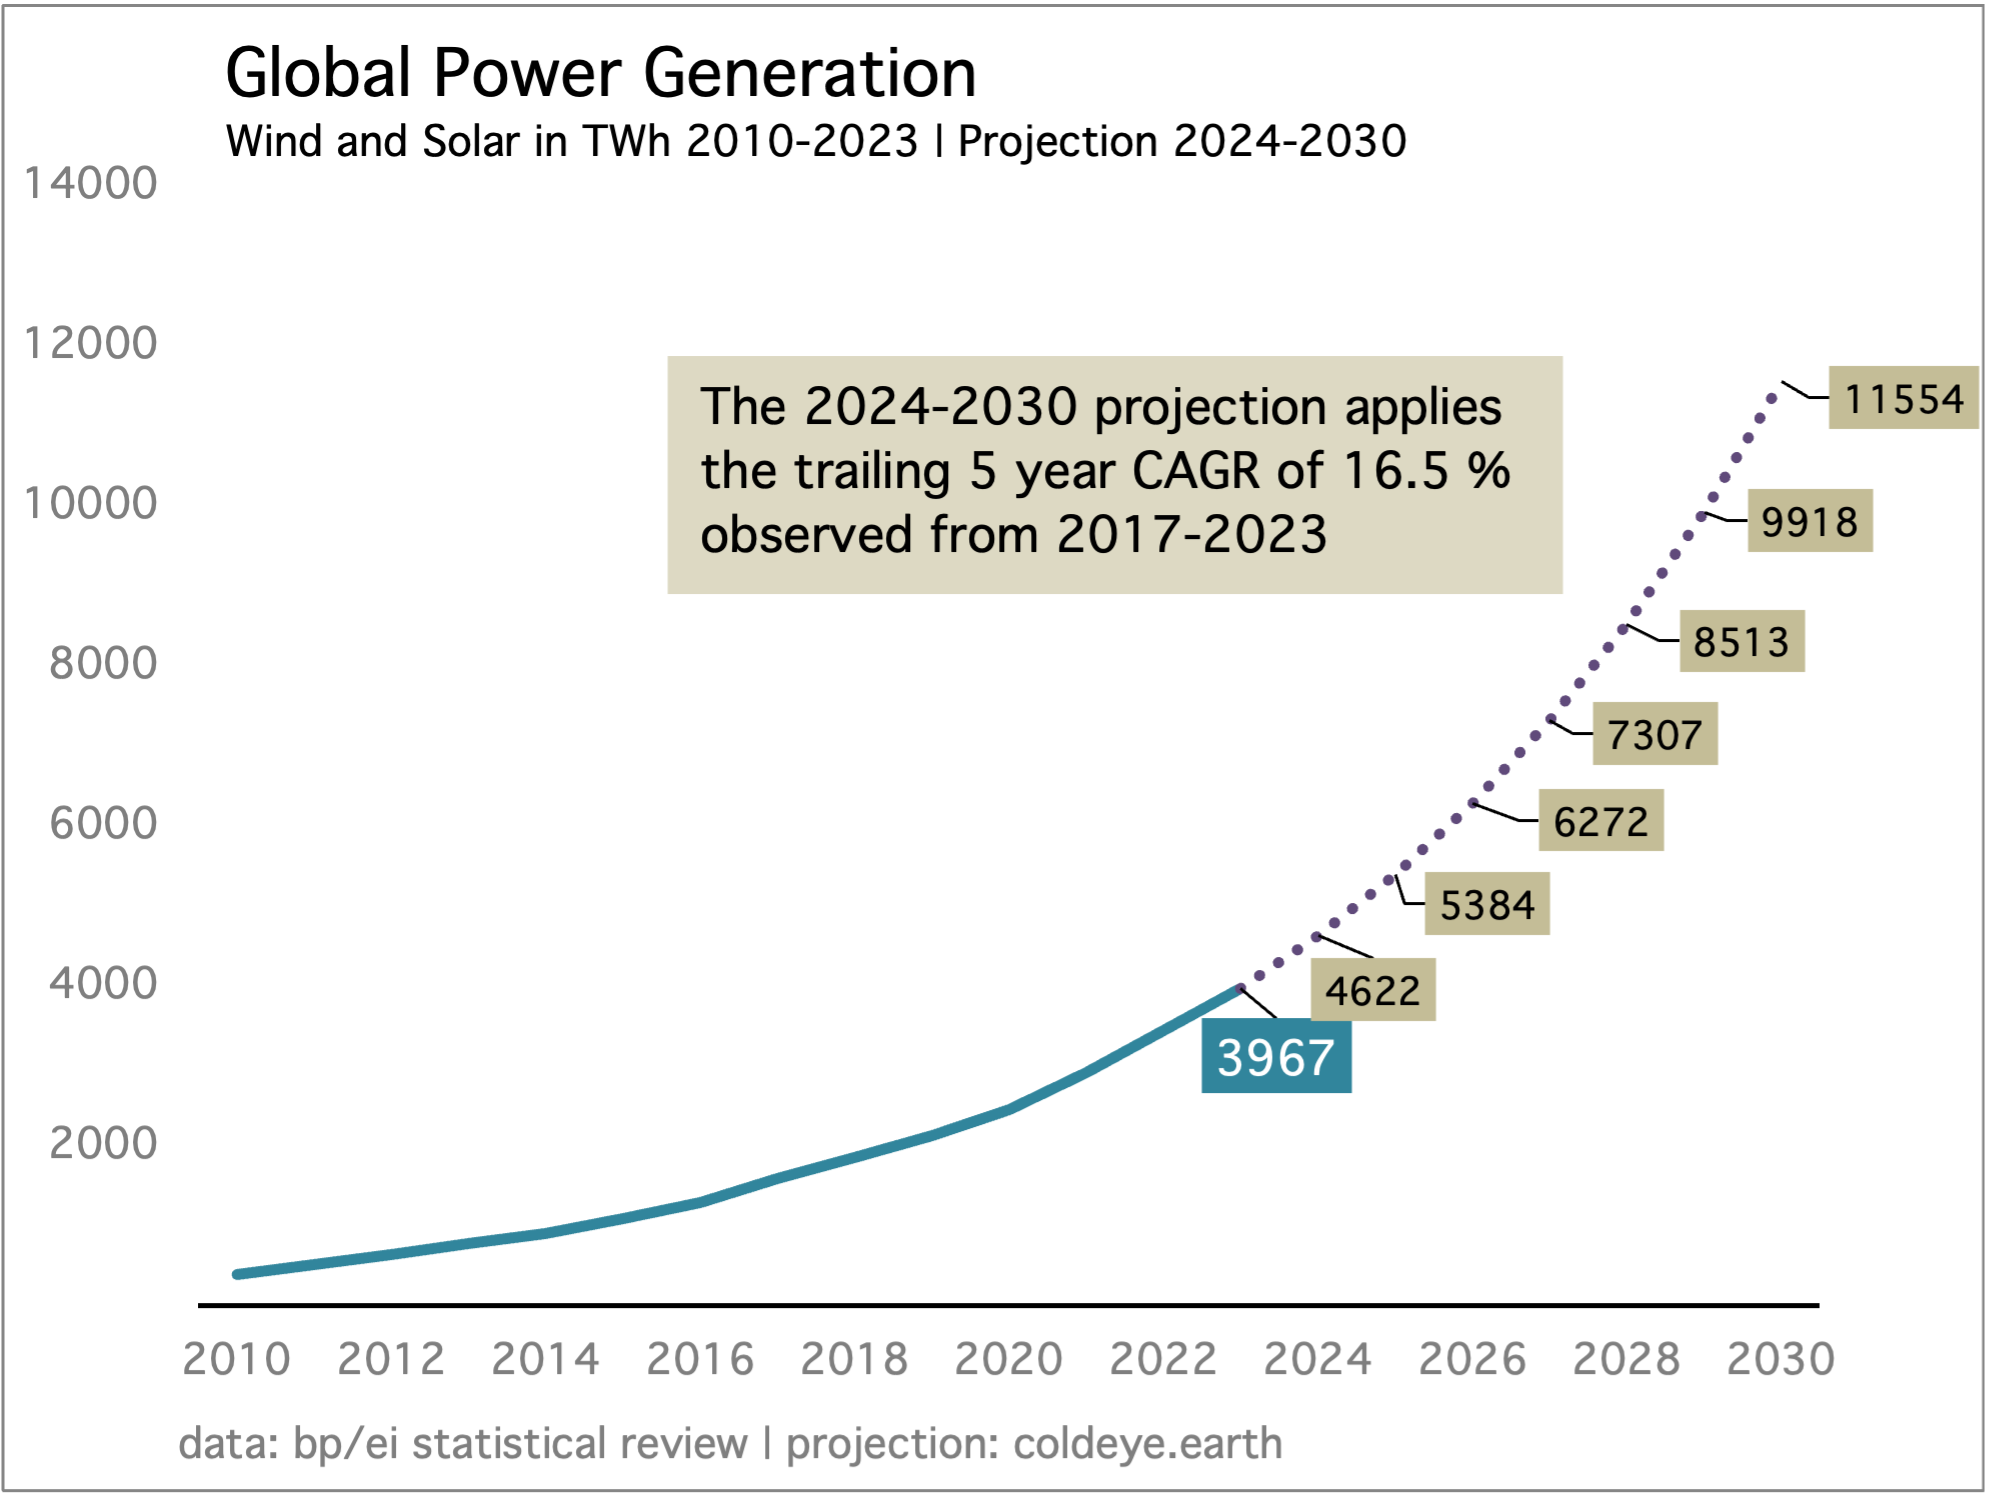
According to the previous chart, the world is going to add 7512 TWh of new electricity demand from 2023 to 2030. The assignment, therefore, is to not merely supply a fresh 7512 TWh of new generation from clean sources. That earns us a plateau of power sector emissions, and nothing more. To force emissions into actual decline will require going well beyond that volume of new generation. How much new clean generation is scheduled to come online?
Let’s take a look at the bulk of it—new wind and solar. On the current course, the world will add 7587 TWh of generation from wind and solar. Almost an exact match of new supply, and new demand. That is terrific news. But, is there a pathway to actually cut fossil fuel generation? No, there is not.
What about nuclear and hydropower? Unfortunately, global hydropower has become increasingly volatile, surging in some years, then succumbing to severe drought in others. California and Brazil are excellent examples of this new problem. California used to be able to rely on a moderately stable annual output of hydropower. No more. Meanwhile, although countries like China are helpfully building new nuclear, retirements of an aging global fleet of nuclear power are still tending to negate new nuclear—partly because the rate of new nuclear capacity is also painfully slow.
If you think the above chart is too conservative, let me caution you: maintaining a 16.5% compound annual growth rate will start to get rather difficult as we ascend from 3967 TWh of wind+solar generation last year, to levels above 6000 TWh. Consider, for example, that going from 6272 TWh in 2027 to 7307 TWh in 2028 will require that wind and solar generation advance, in a single year, by nearly 1100 TWh. Moreover, notice also that Cold Eye Earth is not embracing a 4.00% growth rate of total annual system growth from now through the end of the decade. The 3.25% system growth modeled here may also turn out to be too conservative. And we should take that risk seriously. Especially if the next two high growth years are followed, say, by a down year, and then we return to even higher growth, above 4.00%.
Let’s also speculate a little. What if the world is about to fall into a pattern where marginal power system growth is indeed covered by new wind, solar, storage, with some minor help from hydro and nuclear? This might suggest that, from a business standpoint, the world is happy to deploy new capacity to serve new demand, but is not as well set up to forcefully retire incumbent generation, because of political considerations? It’s easy to point the finger at China, or India, and accuse those countries of intermingling state interests with commercial interests. But is it really so different in the west? Shutting down legacy generation may face different levels of difficulty across various domains, but, generally speaking, shutting down existing capacity represents the destruction of someone’s asset, and that’s true everywhere.
US power growth is now quite nicely being covered by wind and solar. Here is a very instructive chart showing what a power system looks like when its fossil fuel generation has been halted, and all new growth is being covered by new wind and solar. While fossil fuel generation actually declined for a while, from 2010 - 2020, the past several years have seen this decline halted, as wind and solar have been tasked with covering real growth in US power demand overall. This is actually a nice portrait of the challenge: in a static, non-growing system, you can trigger fossil fuel declines pretty easily. That was the case from 2010 - 2020. But when the system itself grows, the challenge gets alot harder.
News Briefs • Form Energy, the innovative, long duration battery maker using iron-air technology, is now set to install a 100 hour battery in the state of Maine. Readers may recall that Form has also struck deals in other states, as it did last year in Colorado. • A micro-study of health and well being among Southern California’s beach cities, like Redondo and Hermosa, shows that this region’s far higher standard of health saves residents over $180 million in healthcare costs. • The Wall Street Journal reported that the saboteurs of the offshore Nordstream pipeline were in fact from Ukraine, and colorfully, were a team assembled under the watch of President Zelensky, who ultimately tried and failed to call the operation off. What’s interesting is the journalism community and other observers are not taking the report seriously. • Climate change will present challenges for carceral states. This is grim reading, but the incidence of heat related deaths in US prisons has started to rise. In the UK, a government report warns that 75% of the nation’s prisons will overheat over the next 15 years. • Glen Peters, of CICERO, estimates that global emissions will rise 0.6% this year. •
California petrol consumption continues its gentle decline. Your faithful correspondent has followed California’s energy consumption and policies for nearly two decades, patiently waiting for all the factors to line up to make the call for decline. About 18 months ago, Cold Eye Earth, decided that call was warranted. | see: End of the Road.
The surging support for the Harris-Walz campaign on a compressed timeline is surely one of the most unique occurrences in US political history. Joe Biden was on course to lose the election, and only dropped out four weeks ago! In that time Harris locked down the Democratic base (as demonstrated by rapidly falling support for 3rd party candidates), picked a running mate, and is now about to be coronated at the Democratic National Convention in Chicago. But enough happy talk. Let’s get to the actual election outlook.
If the election were held today, Harris would be likely to win a close election, as she is roughly 2-3 points ahead in national polling, but more importantly, is leading in the crucial Midwest 3 of WI, MI, PA. She has also now put North Carolina (NC) into play, which is surprising though not shocking. After all, NC was Trump’s narrowest margin win in 2020, beating Biden by just 1.35%.
To echo the political discussion from last time, each candidate has two states that are so important, that if the opponent takes them, their route to 270 electoral votes shrinks dramatically. For the Dem nominee, the dearest state is PA. If Harris wins PA, she is definitely winning MI and WI, and as we know, that puts the Dem nominee in a position that is rock solid. No need to win AZ. No need to win GA. Or even NV! If Harris wins the Midwest 3, her win probabilities soar to above 95%.
And what about Trump? For the GOP candidate, NC is the dearest state that simply cannot be allowed to fall into the Dem column. Remember, Biden won the national vote last time by over 5.00%. And yet he still lost NC by over 1.00%. Provisionally, you can consider therefore that NC is structurally defended by a lean towards the GOP candidate that starts out with a 6 point advantage. If Harris-Walz, therefore, can put NC into play and actually win it, that strongly suggest Harris will surge to a 6+ percentage point victory over Trump on a national basis, which would topple other states for her too. To put it simply: if she is winning NC, then she will have no problem locking down the Midwest 3, plus other states like AZ and GA. Over the weekend, the New York Times/Sienna poll had Harris up 2 points in NC. Last week, the Cook Political Report had Harris up by 1 point in NC.
Now let’s go to the map. As always, we start with the 2020 result as applied to the 2024 map, and electoral college changes since 2020. At the moment, Harris is on course to duplicate Biden’s performance but with two uncertainties. One, it’s not clear yet if Harris can win GA. Remember, that was Biden’s closest margin victory (the 11,779 votes that Trump made famous by telling the GA Secretary of State “I just need 11,779 votes!). The other uncertainty now is North Carolina. Trump must win it, and, he must take at least one of the Midwest 3 to have a path to the election. Overall, however, Harris is now in the far stronger position.

—Gregor Macdonald